Well Monitoring
The Well screen ties the live downhole conditions to the motor / pump operating envelope. It is the screen you go to when the question is "is this well producing safely, and can I restart it?" Access it from the Well tab in the navigation sidebar.
Reading the Well Screen
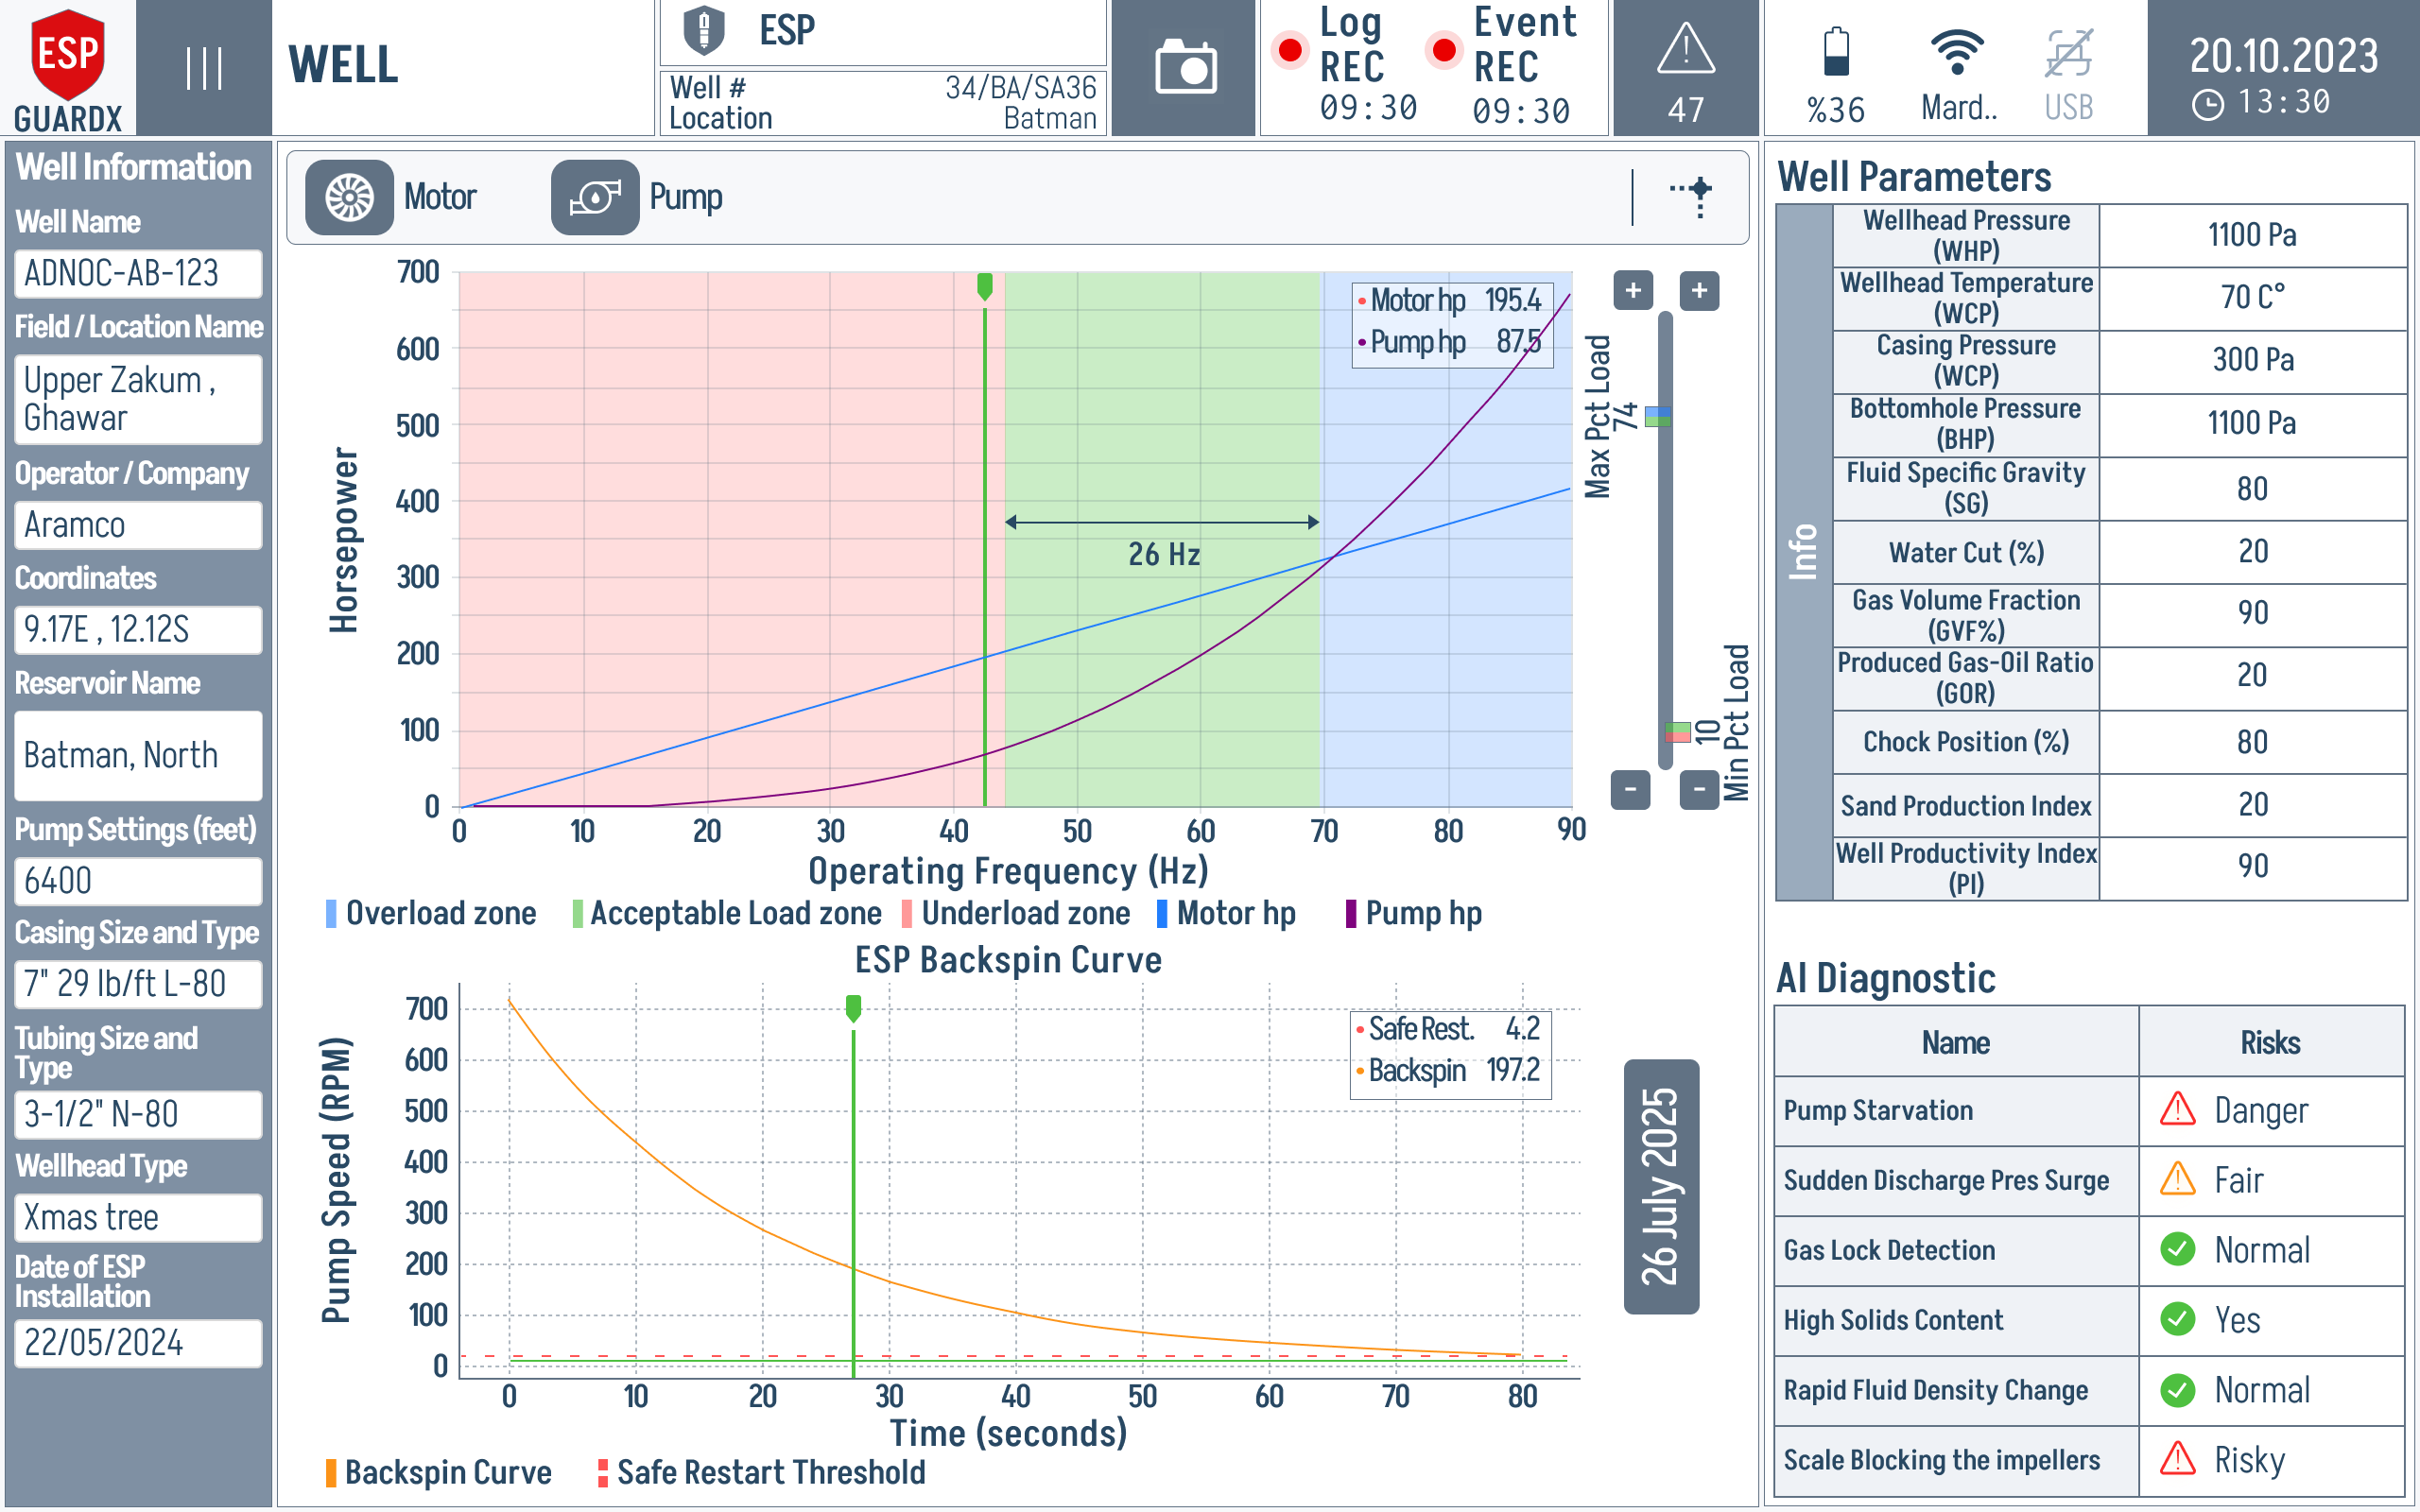
The Well screen has four working areas — two charts on the left for operating envelope analysis and two panels on the right for live well health.
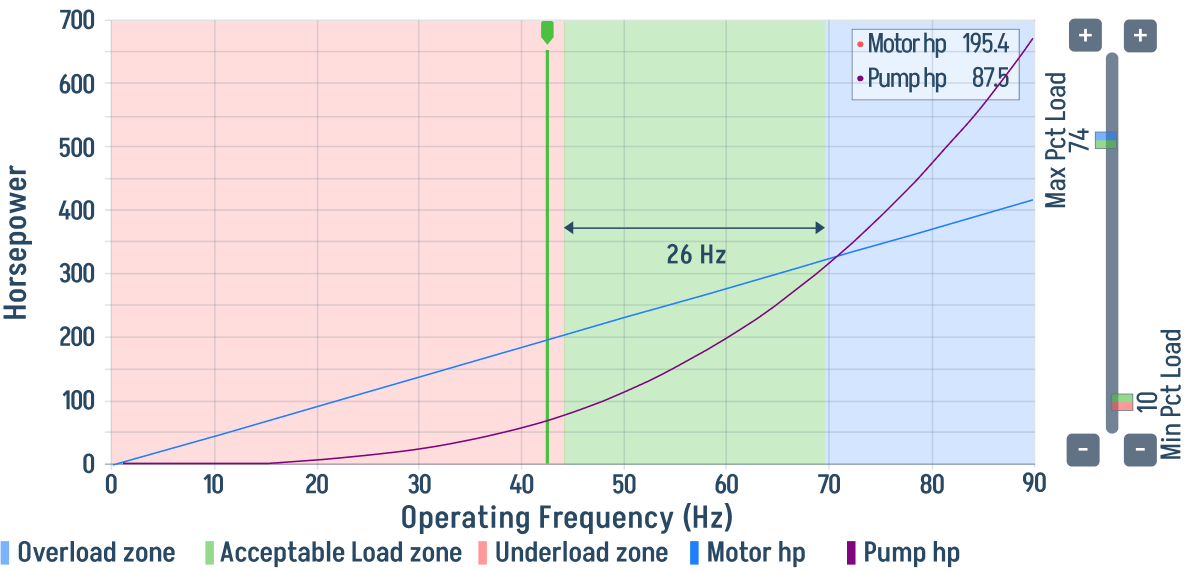
Operating Frequency vs Motor / Pump hp chart (top left) — banded background shows Overload Zone, Acceptable Load, Underload Zone. The live operating point is plotted on top.
The vertical green marker is the current operating frequency. Read it against the coloured bands first: green means the motor/pump combination is inside the expected load window; red indicates overload or underload risk.
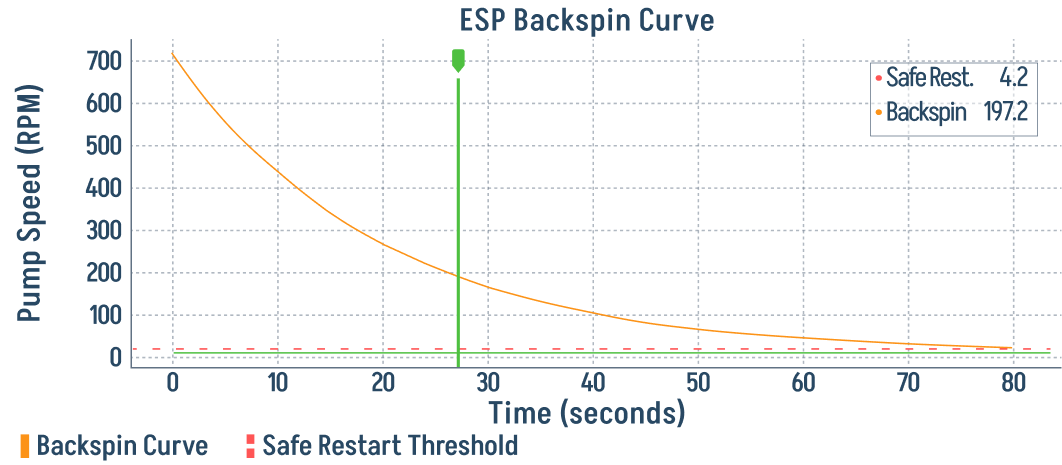
Backspin / Safe-Restart curve (bottom left) — pump speed (RPM) vs. time after shutdown. Used to confirm the pump has fully stopped before issuing a restart command.
The safe restart decision depends on the curve falling below the dashed threshold, not just on elapsed time. If the pump is still above that threshold, wait before restarting.
Live Well Parameters (top right) — Wellhead Pressure (Pwell), Intake Pressure (Pintake), Discharge Pressure (Pdischarge), casing / tubing / intake / motor temperatures, vibration on the x/y axes, current leakage, and production fractions from the multi-phase meter.
AI Diagnostic (bottom right) — plain-language risk list: Pump Starvation, Sudden Discharge Pressure Surge, Gas Lock Detection, High Solids Content, Rapid Fluid Density Change, Scale Blocking the Impellers.
Operating Envelope Bands
The shaded background of the top chart is the easiest fault check on the device:
- Overload Zone (red band) — the pump/motor combination is being pushed harder than its safe envelope at this frequency. Sustained operation here is what the motor's Overcurrent and pump's Excessive Shaft Torque events are designed to catch.
- Acceptable Load (green band) — normal duty.
- Underload Zone (red band) — the pump is starved or running dry. Watch for Pump Starvation in the AI Diagnostic panel; sustained underload damages thrust bearings and overheats the motor.
If the operating point moves out of the green band, the pump's Tornado Curve Evaluation will usually flag the mode (Down Trust / Up Trust / Pump Overload) within a few seconds.
Backspin Curve
After any shutdown — manual or fault-triggered — fluid in the tubing can spin the pump backwards as it falls back into the well. Restarting before the pump comes to rest can shear the shaft. This chart traces the live pump speed (RPM) until the Safe Restart Threshold is crossed; only then does the system permit a restart command.
Live Well Parameters
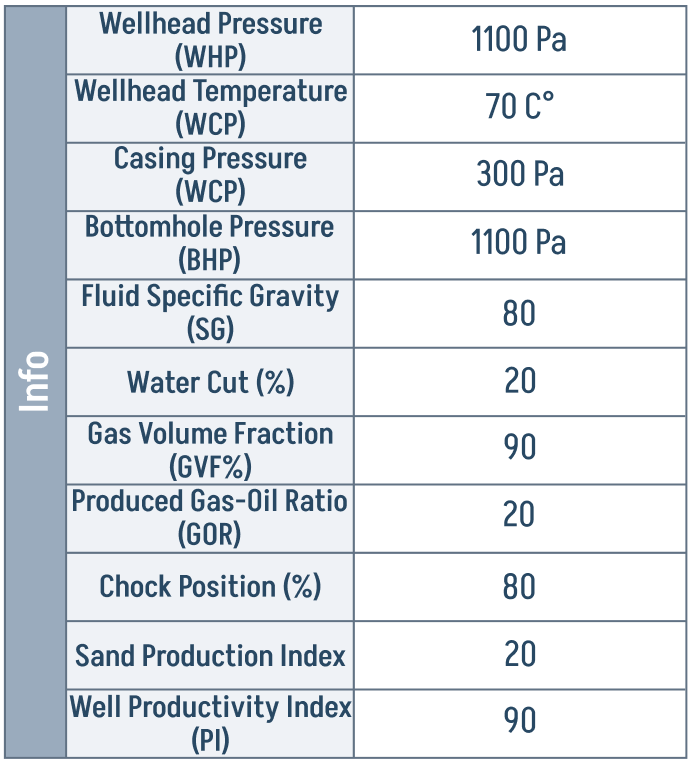
Read this with the AI Diagnostic alongside it — many entries become risks when they cross a threshold (high water cut, falling annulus level, rising sand index). The AI panel turns those raw numbers into named risks.
AI Diagnostic
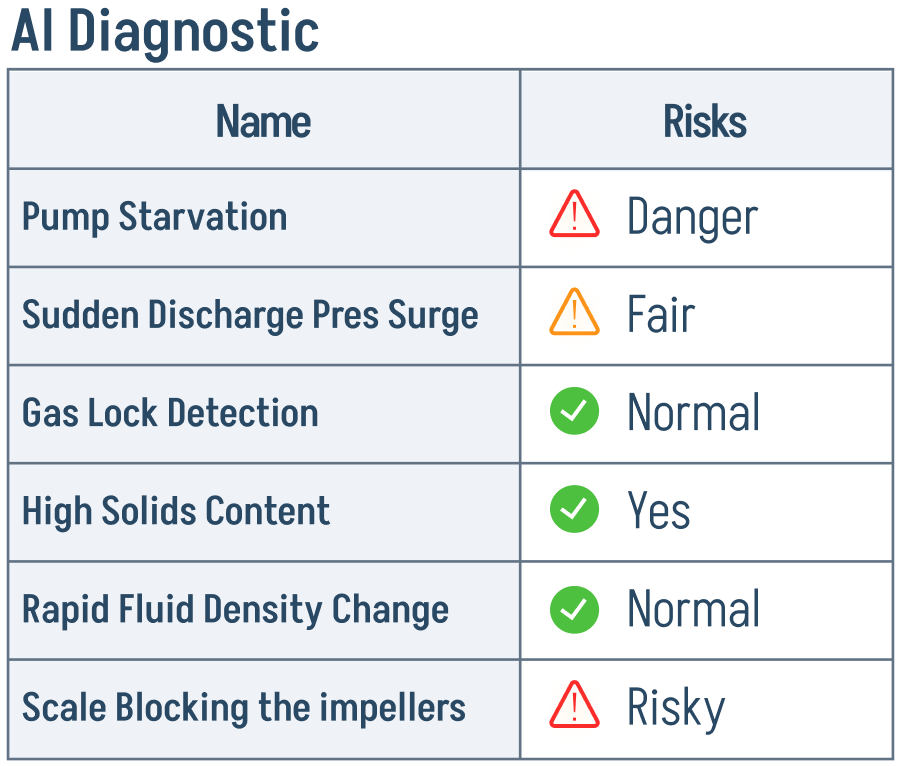
A green check is the desired state. A red triangle on Pump Starvation or Gas Lock is the most common acute fault and usually correlates with the operating point dipping into the Underload Zone on the chart above. A red triangle on Scale Blocking the Impellers or High Solids Content is a longer-term signal — the well needs an intervention, but you do not have to stop production immediately.
Well Parameters
The right-hand panel shows the live downhole and wellhead readings. Parameter names and formulas follow the approved Production and Well Parameters table.
| Parameter | Description |
|---|---|
Flow Rate (Qflow) |
Instantaneous fluid flow rate measured at the wellhead or downhole |
Multi-Phase Meter (Mmulti) |
Source for real-time oil, water, and gas phase fractions |
Water Cut Fraction (fw) |
Fraction of water in the produced fluid |
Oil Cut Fraction (fo) |
Fraction of oil in the produced fluid |
Gas Fraction (fg) |
Fraction of gas in the produced fluid; if not directly measured, fg = 1 - fw - fo |
Wellhead Pressure (Pwell) |
Surface pressure at the wellhead |
Intake Pressure (Pintake) |
Downhole pressure at the pump intake |
Discharge Pressure (Pdischarge) |
Downhole pressure at the pump discharge |
Pressure Drawdown (Pdrawdown) |
Reservoir - Pintake, when static reservoir pressure is available |
Casing Temperature (Tcasing) |
Temperature in the casing annulus |
Tubing Temperature (Ttubing) |
Temperature inside the production tubing |
Intake Temperature (Tintake) |
Downhole fluid temperature at pump intake |
Motor Temperature (Tmotor) |
Internal ESP motor temperature |
Vibration (Vvib) |
Radial vibration of the downhole equipment on the x/y axes |
Current Leakage (Ileak) |
Sensed ground fault or calculated leakage current |
AI Diagnostic
The lower-right AI Diagnostic panel calls out risk conditions in plain language — e.g., Pump Starvation, Sudden Discharge Drop, Gas Lock, High Solids Content, Rapid Fluid Density Change, Scale Blocking the Impellers — with a status flag next to each.
Monitored Well Parameters
The following well parameters are continuously monitored and can trigger events:
| Parameter | Description | Default Warn | Default Trip |
|---|---|---|---|
| WH Tubing Pressure High | Wellhead tubing pressure above limit | 15% | 25% |
| WH Tubing Pressure Low | Wellhead tubing pressure below limit | 10% | 5% |
| Casing Pressure High | Casing pressure above limit | 20% | 30% |
| BH Temperature High | Bottomhole temperature exceeds limit | 150 C | 180 C |
| High Water Cut | Water cut percentage too high | 60% | 80% |
| High Gas-Oil Ratio | GOR exceeds limit | 50% | 75% |
| Sand Production Index | Sand content in produced fluid | 10% | 20% |
| Annulus Fluid Low | Low fluid level in annulus | 15% | 25% |
See Event Settings to customize these thresholds.