Viewing Events
The Events screen lets you browse, filter, and analyze recorded events. Access it from the Events tab in the navigation sidebar.
Screen Layout
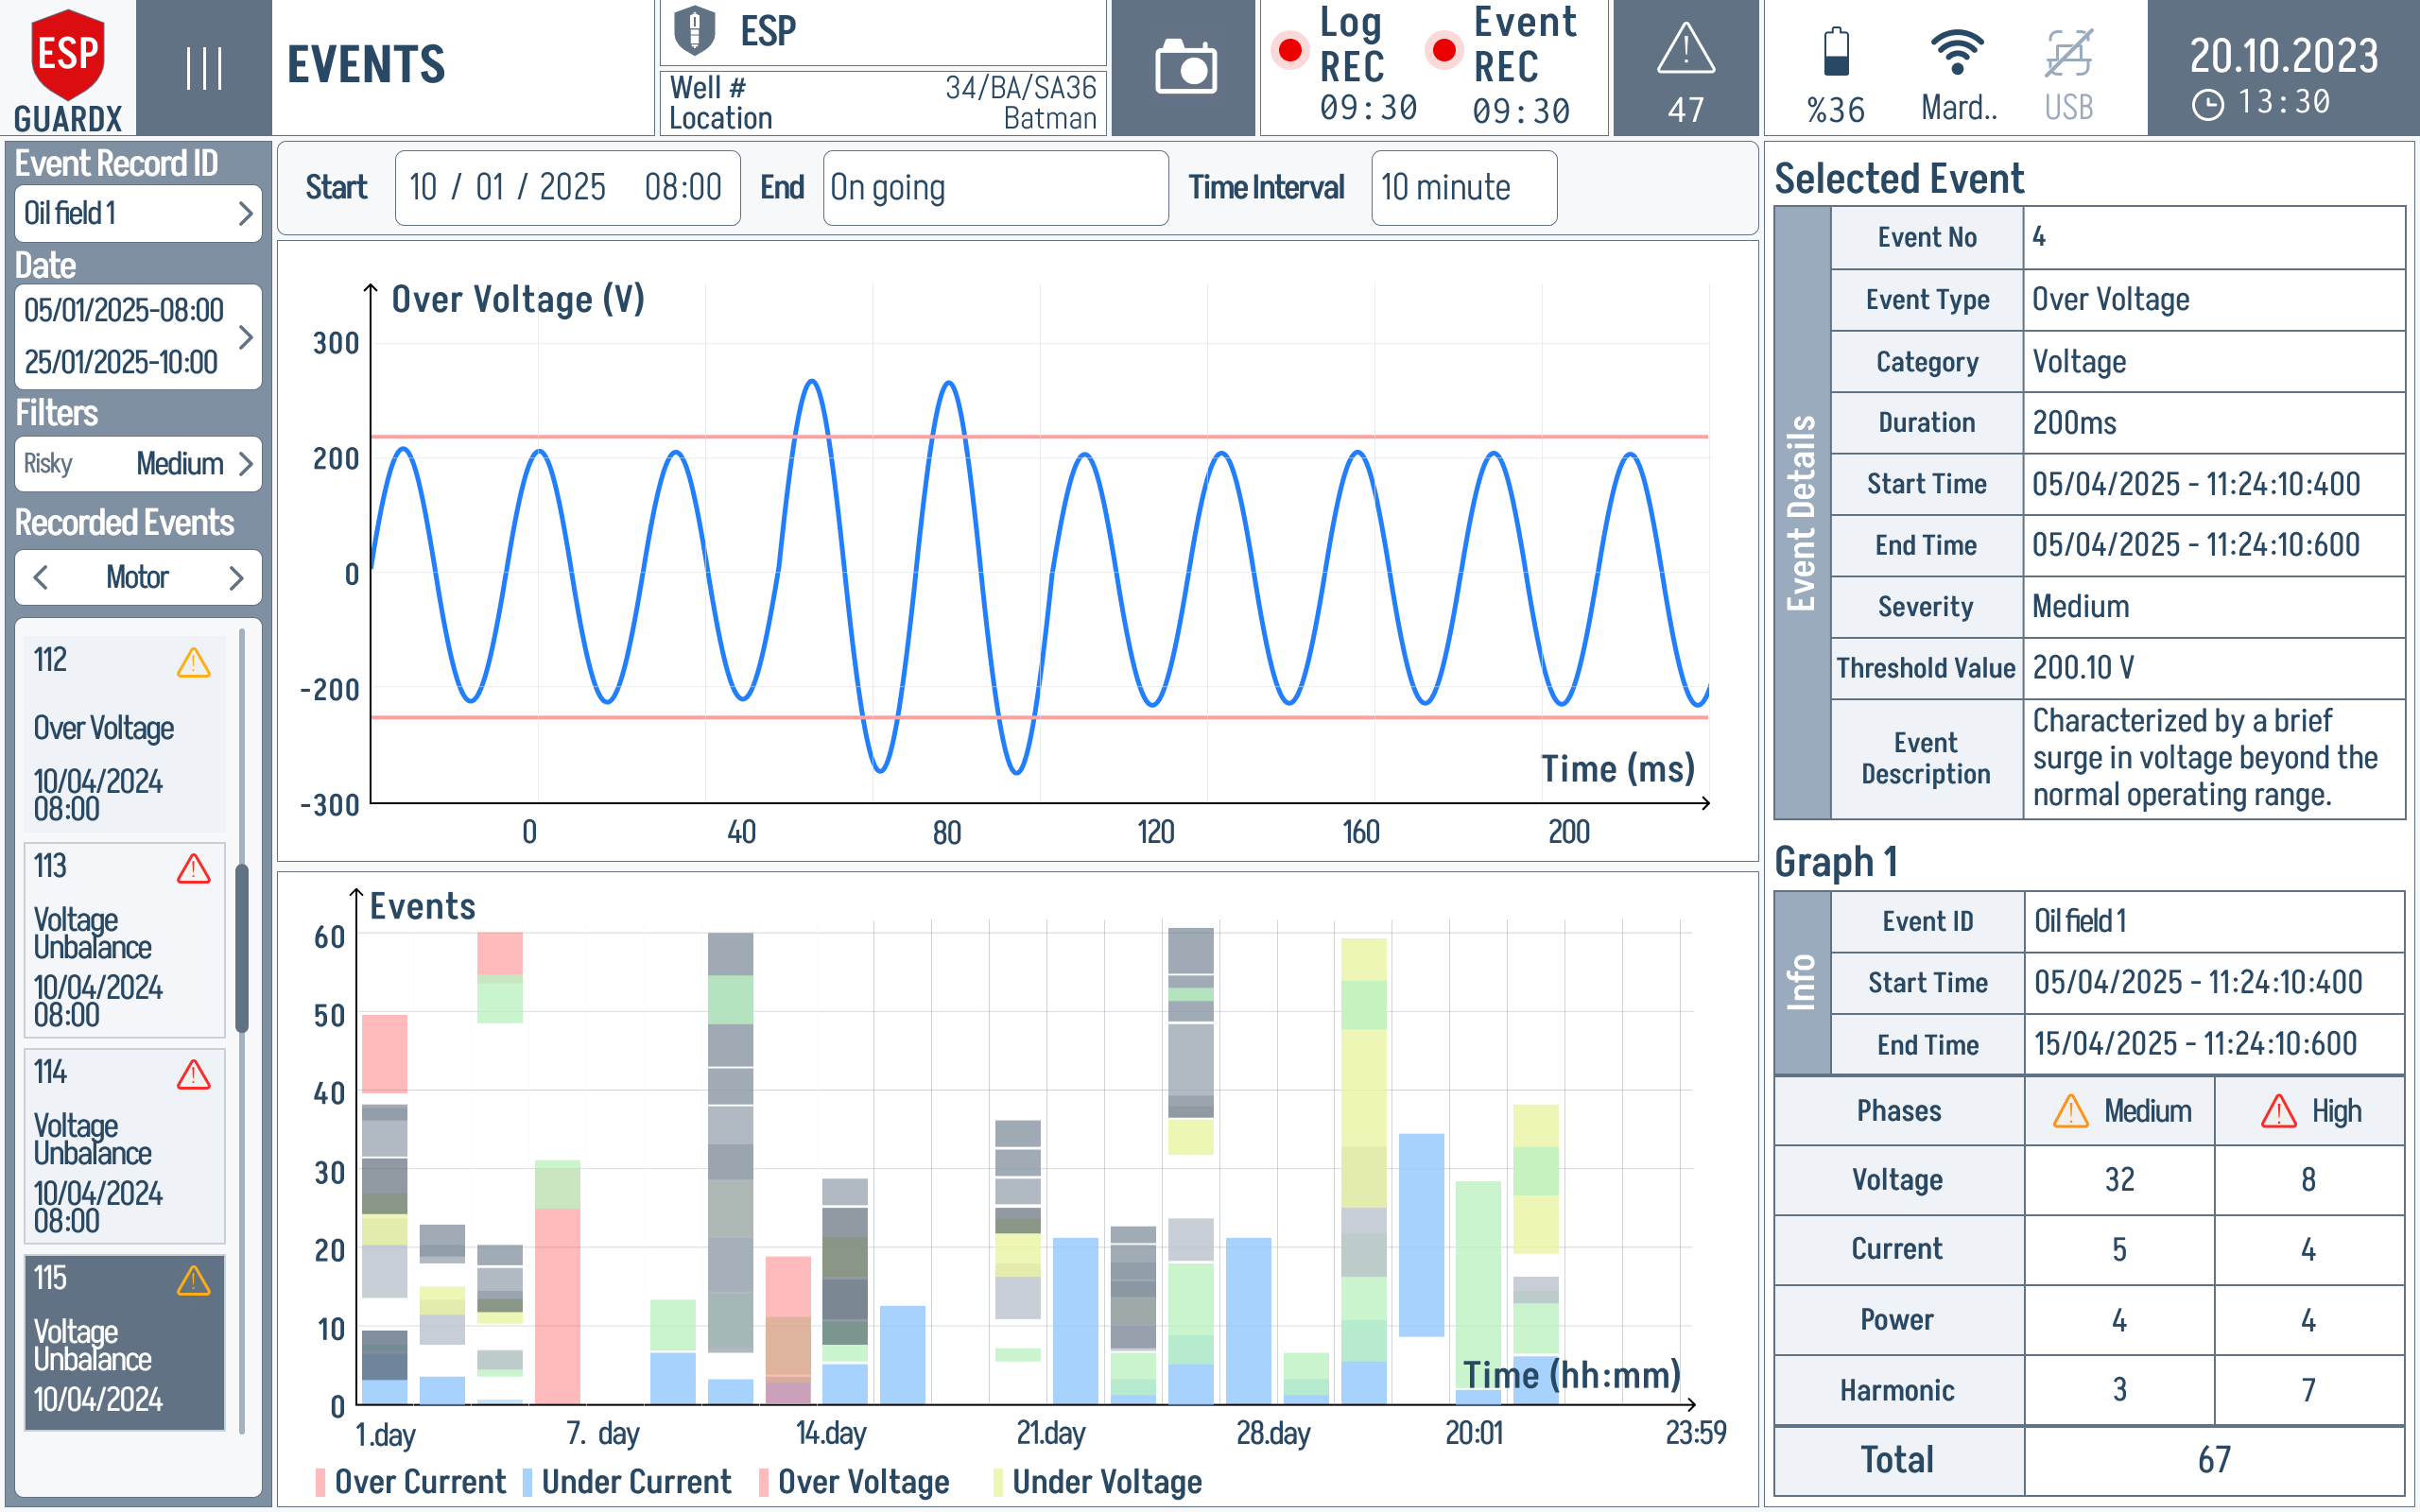
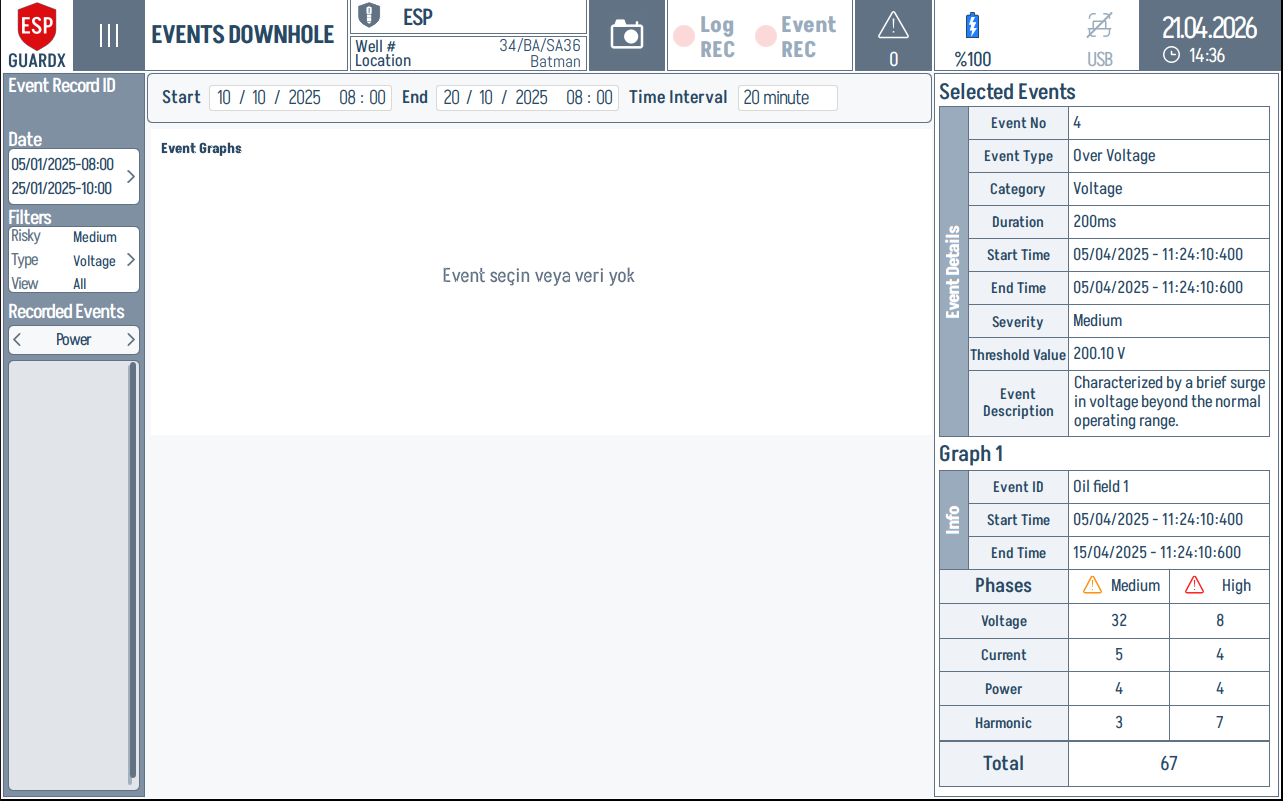
The Events screen is split into three columns:
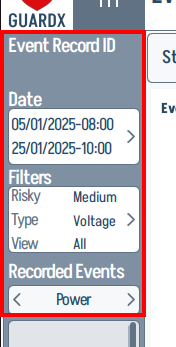
- Left column — Event Record ID, Date range (Start / End), Filters (Risk, Type, View), and the list of Recorded Events grouped by category (Power, Motor, Pump, Well).
- Center column — Event Graphs. When an event is selected, its waveform is drawn here with threshold lines and the event-count chart below it. Until you pick one, the panel shows the "select event or no data" prompt.
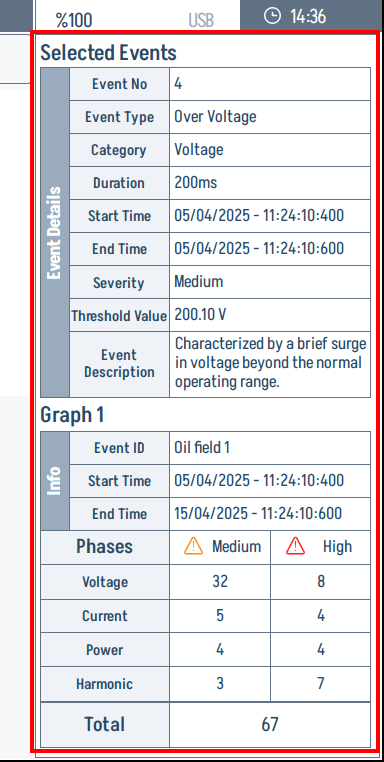
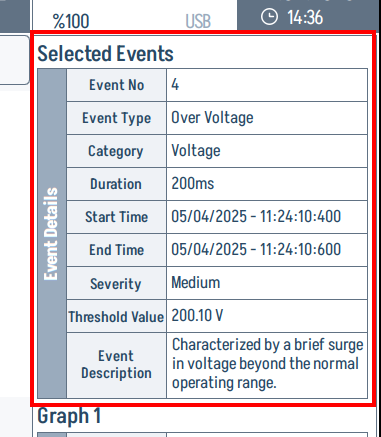
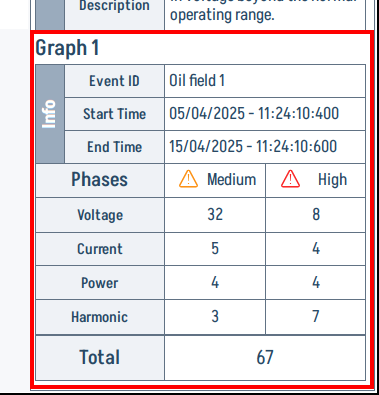
- Right column — Selected Events detail card (Event No, Type, Category, Duration, Start/End Time, Severity, Threshold Value, Description) and a Graph 1 Info card with phase-level counts for Voltage, Current, Power, and Harmonic anomalies.
Filtering Events
You can narrow the event list by:
- Date range -- Set a Start / End window, or tap All Days to clear
- Risk -- Medium, High
- Type -- Voltage, Current, Power, Harmonic, etc.
- View -- All recorded, or a specific subset
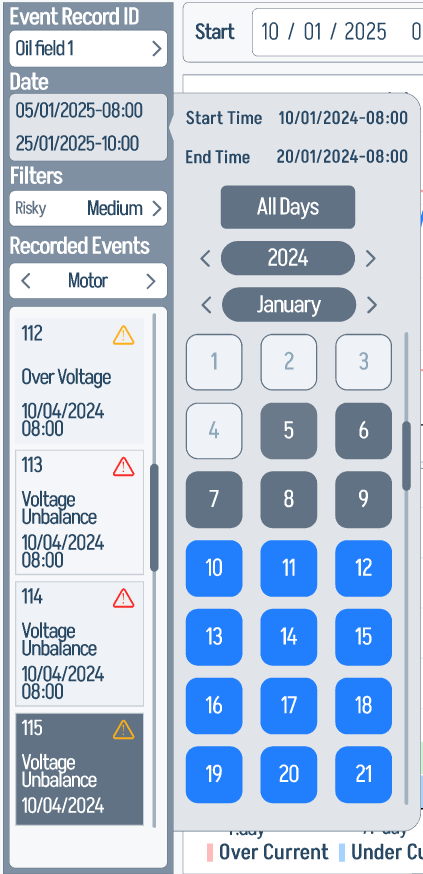
Date Picker
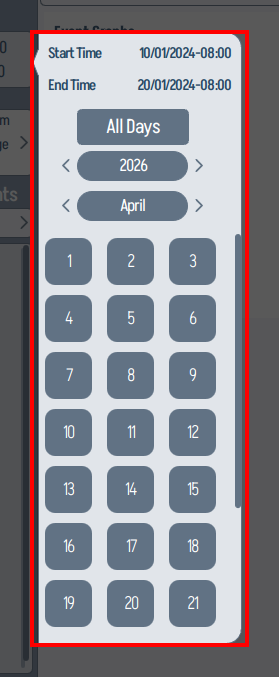
Tap the Date field to open the month / year picker. Use the arrows to step through months or years, then tap a day to jump to that date. Tap All Days to clear the filter.
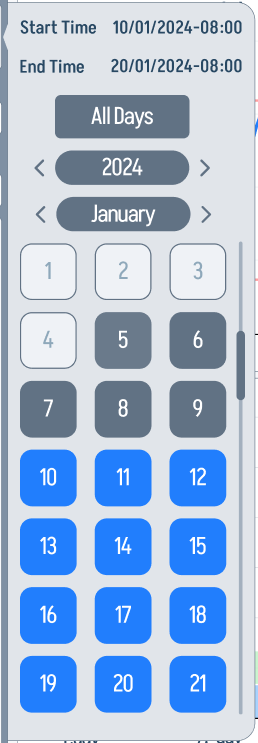
A zoom of the picker dialog itself:
The same picker is available on the dedicated Events Downhole screen:
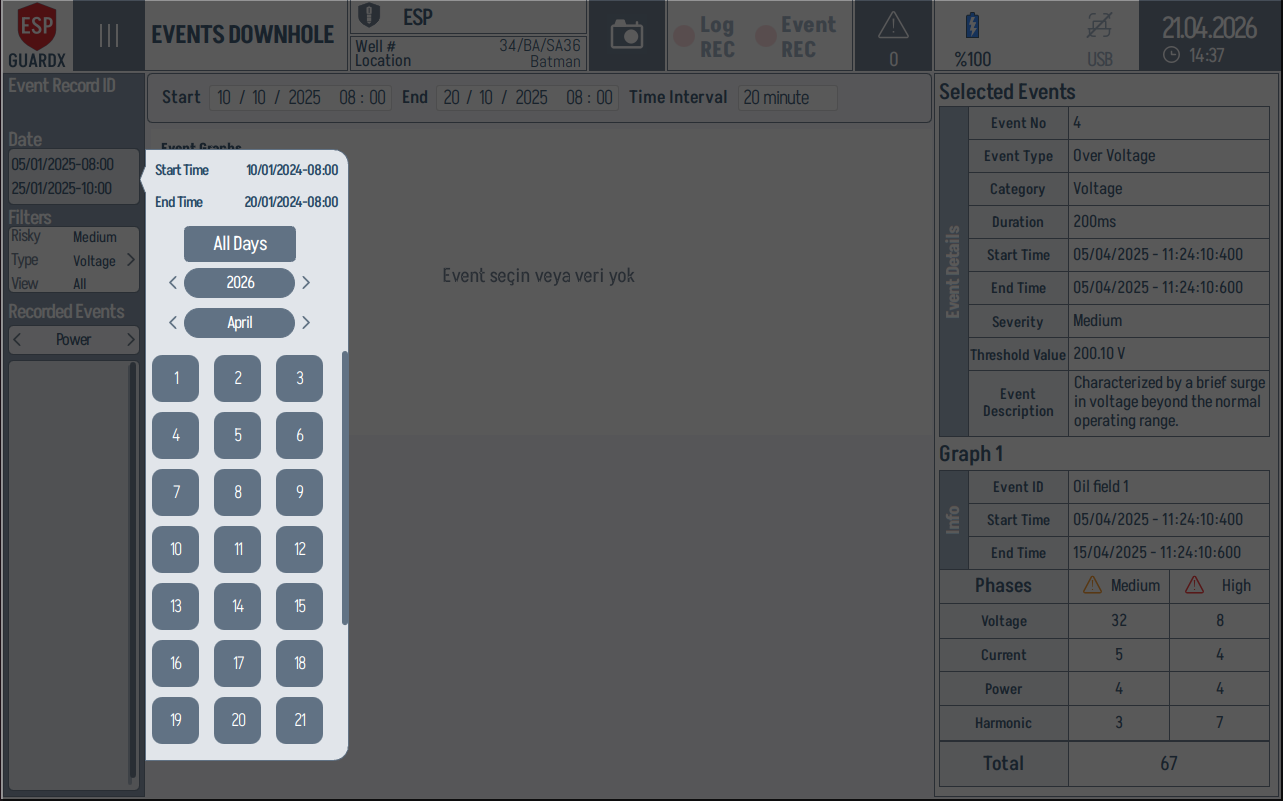
Events Downhole Screen
ESP-GUARDX also exposes a dedicated Events Downhole screen with the same three-column layout, scoped to downhole-side events (wellhead / motor / pump).
The downhole screen reuses the three-column layout. Each column is highlighted below.
Left column — record ID, date range, filters, recorded events list.
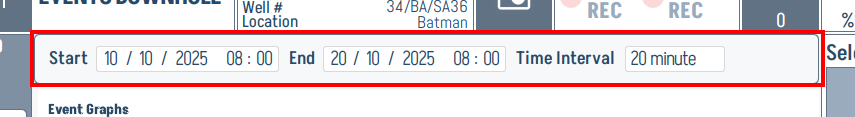
Top time bar — Start / End / Time Interval inputs.
Right column — Selected Events detail + Graph 1 Info.
The detail card on top breaks the most-recent event into a row-per-attribute view:
The Graph 1 Info card underneath aggregates the per-phase event counts (Voltage / Current / Power / Harmonic) by severity (Medium / High):
When an Event is Selected
Tap any event in Recorded Events to load its metadata into the right-hand detail card and render its waveform in the Event Graphs pane.
In the example above, an Over Voltage event is selected. The waveform crosses the upper and lower threshold bands, while the right-side detail card records the event number, type, duration, severity, threshold value, and description. Use those two areas together: the waveform tells you what happened electrically, and the detail card tells you how ESP-GUARDX classified it.
Event Information
The right-hand detail card shows the event metadata:
- Event ID
- Trigger timestamp
- Event category and parameter
- Threshold values (warn/trip)
- Measured value at trigger
- Event duration
Waveform Viewer
The main area of the event detail view is an 8-channel waveform viewer that displays the recorded data. This is the same oscilloscope-style view used for live monitoring, but showing the stored event data.
Key features of the event waveform viewer:
- Scrollable timeline -- Pan through the entire recording from pre-trigger to post-trigger
- Pre-trigger data -- See what the system was doing before the fault
- Trigger marker -- Clear indication of the exact moment the event was detected
- Post-trigger data -- See how the system responded after the fault
- 8 channels -- All voltage and current waveforms are available
Reading Event Waveforms
- Start at the left -- This is the pre-trigger data (before the fault)
- Find the trigger marker -- This is where the threshold was exceeded
- Look for changes -- Compare the waveforms before and after the trigger
- Identify the root cause -- Use the waveform shape to diagnose the fault type
Exporting Event Data
Event data can be exported in CSV format for analysis in external tools (spreadsheets, MATLAB, Python, etc.). The exported file contains time-stamped samples for all 8 channels.
Event Data Storage
Event files are stored in the device's internal storage. Each event consists of a .bin file (waveform data) and a .json file (metadata). Files can be transferred off the device via USB for archival.
Storage
Each data packet is approximately 19.7 KB in binary format. A typical event with 10 pre-trigger packets and 10 post-trigger packets uses approximately 400 KB of storage.