Performance Data Viewer
The ESP Performance viewer is the playback tool for the long-term data logs you configured in Performance Logger Settings. Access it from the ESP Performance item in the navigation sidebar.
Reading the Viewer
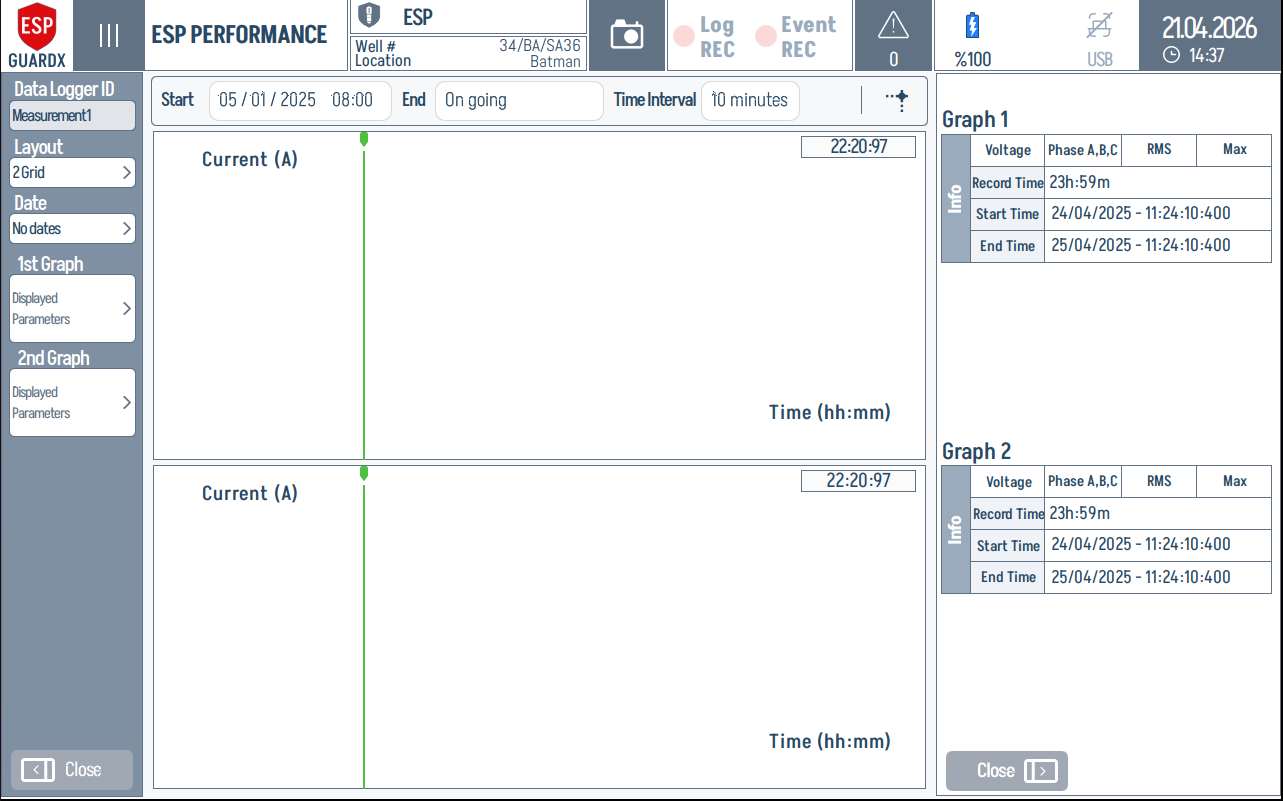
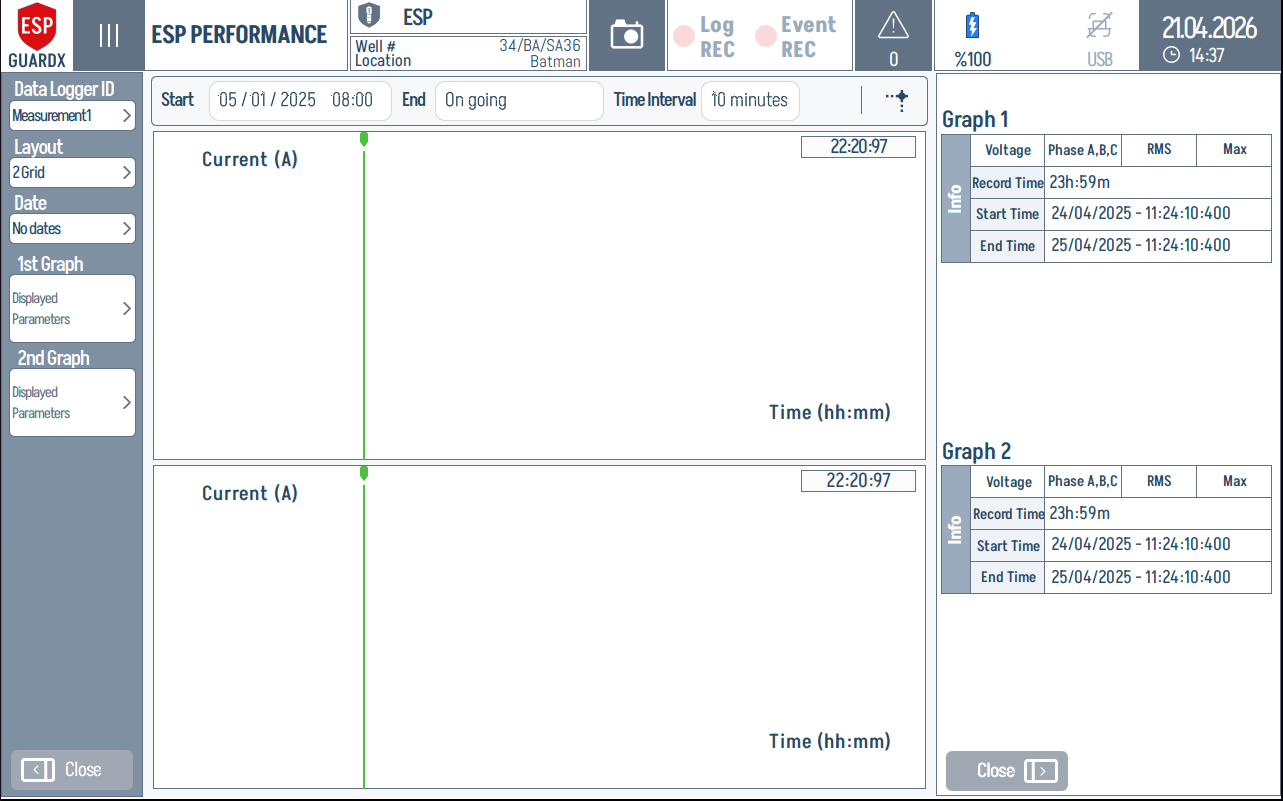
Four regions, left → top → right:
| # | Region | Purpose |
|---|---|---|
| 1 | Left controls | Pick the Data Logger ID (recording), the Layout (2 Grid / 1 Grid / Full View), the Date filter, and the parameter set for 1st Graph / 2nd Graph. |
| 2 | Time controls | Start / End define the visible window (End can be On going for a live recording); Time Interval is the chart's sampling interval (e.g. 10 minutes). |
| 3 | Graph 1 info card | Reference values for graph 1 — signal type, phase selection, RMS / Max, Record Time, Start Time, and End Time of the rendered window. |
| 4 | Graph 2 info card | Same per-graph metadata for graph 2. Both info cards stay in sync with the chart pan/zoom. |
Selecting Display Parameters
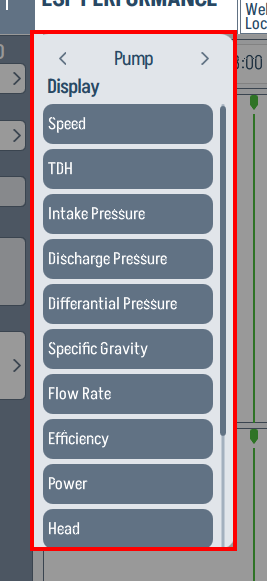
Tap Displayed Parameters on either graph to open the parameter picker. Use the arrows to step through categories (Pump, Motor, Well, Power) and tap the signals you want to chart. The Pump category, for example, exposes Speed, TDH, Intake Pressure, Discharge Pressure, Differential Pressure, Specific Gravity, Flow Rate, Efficiency, Power, and Head.
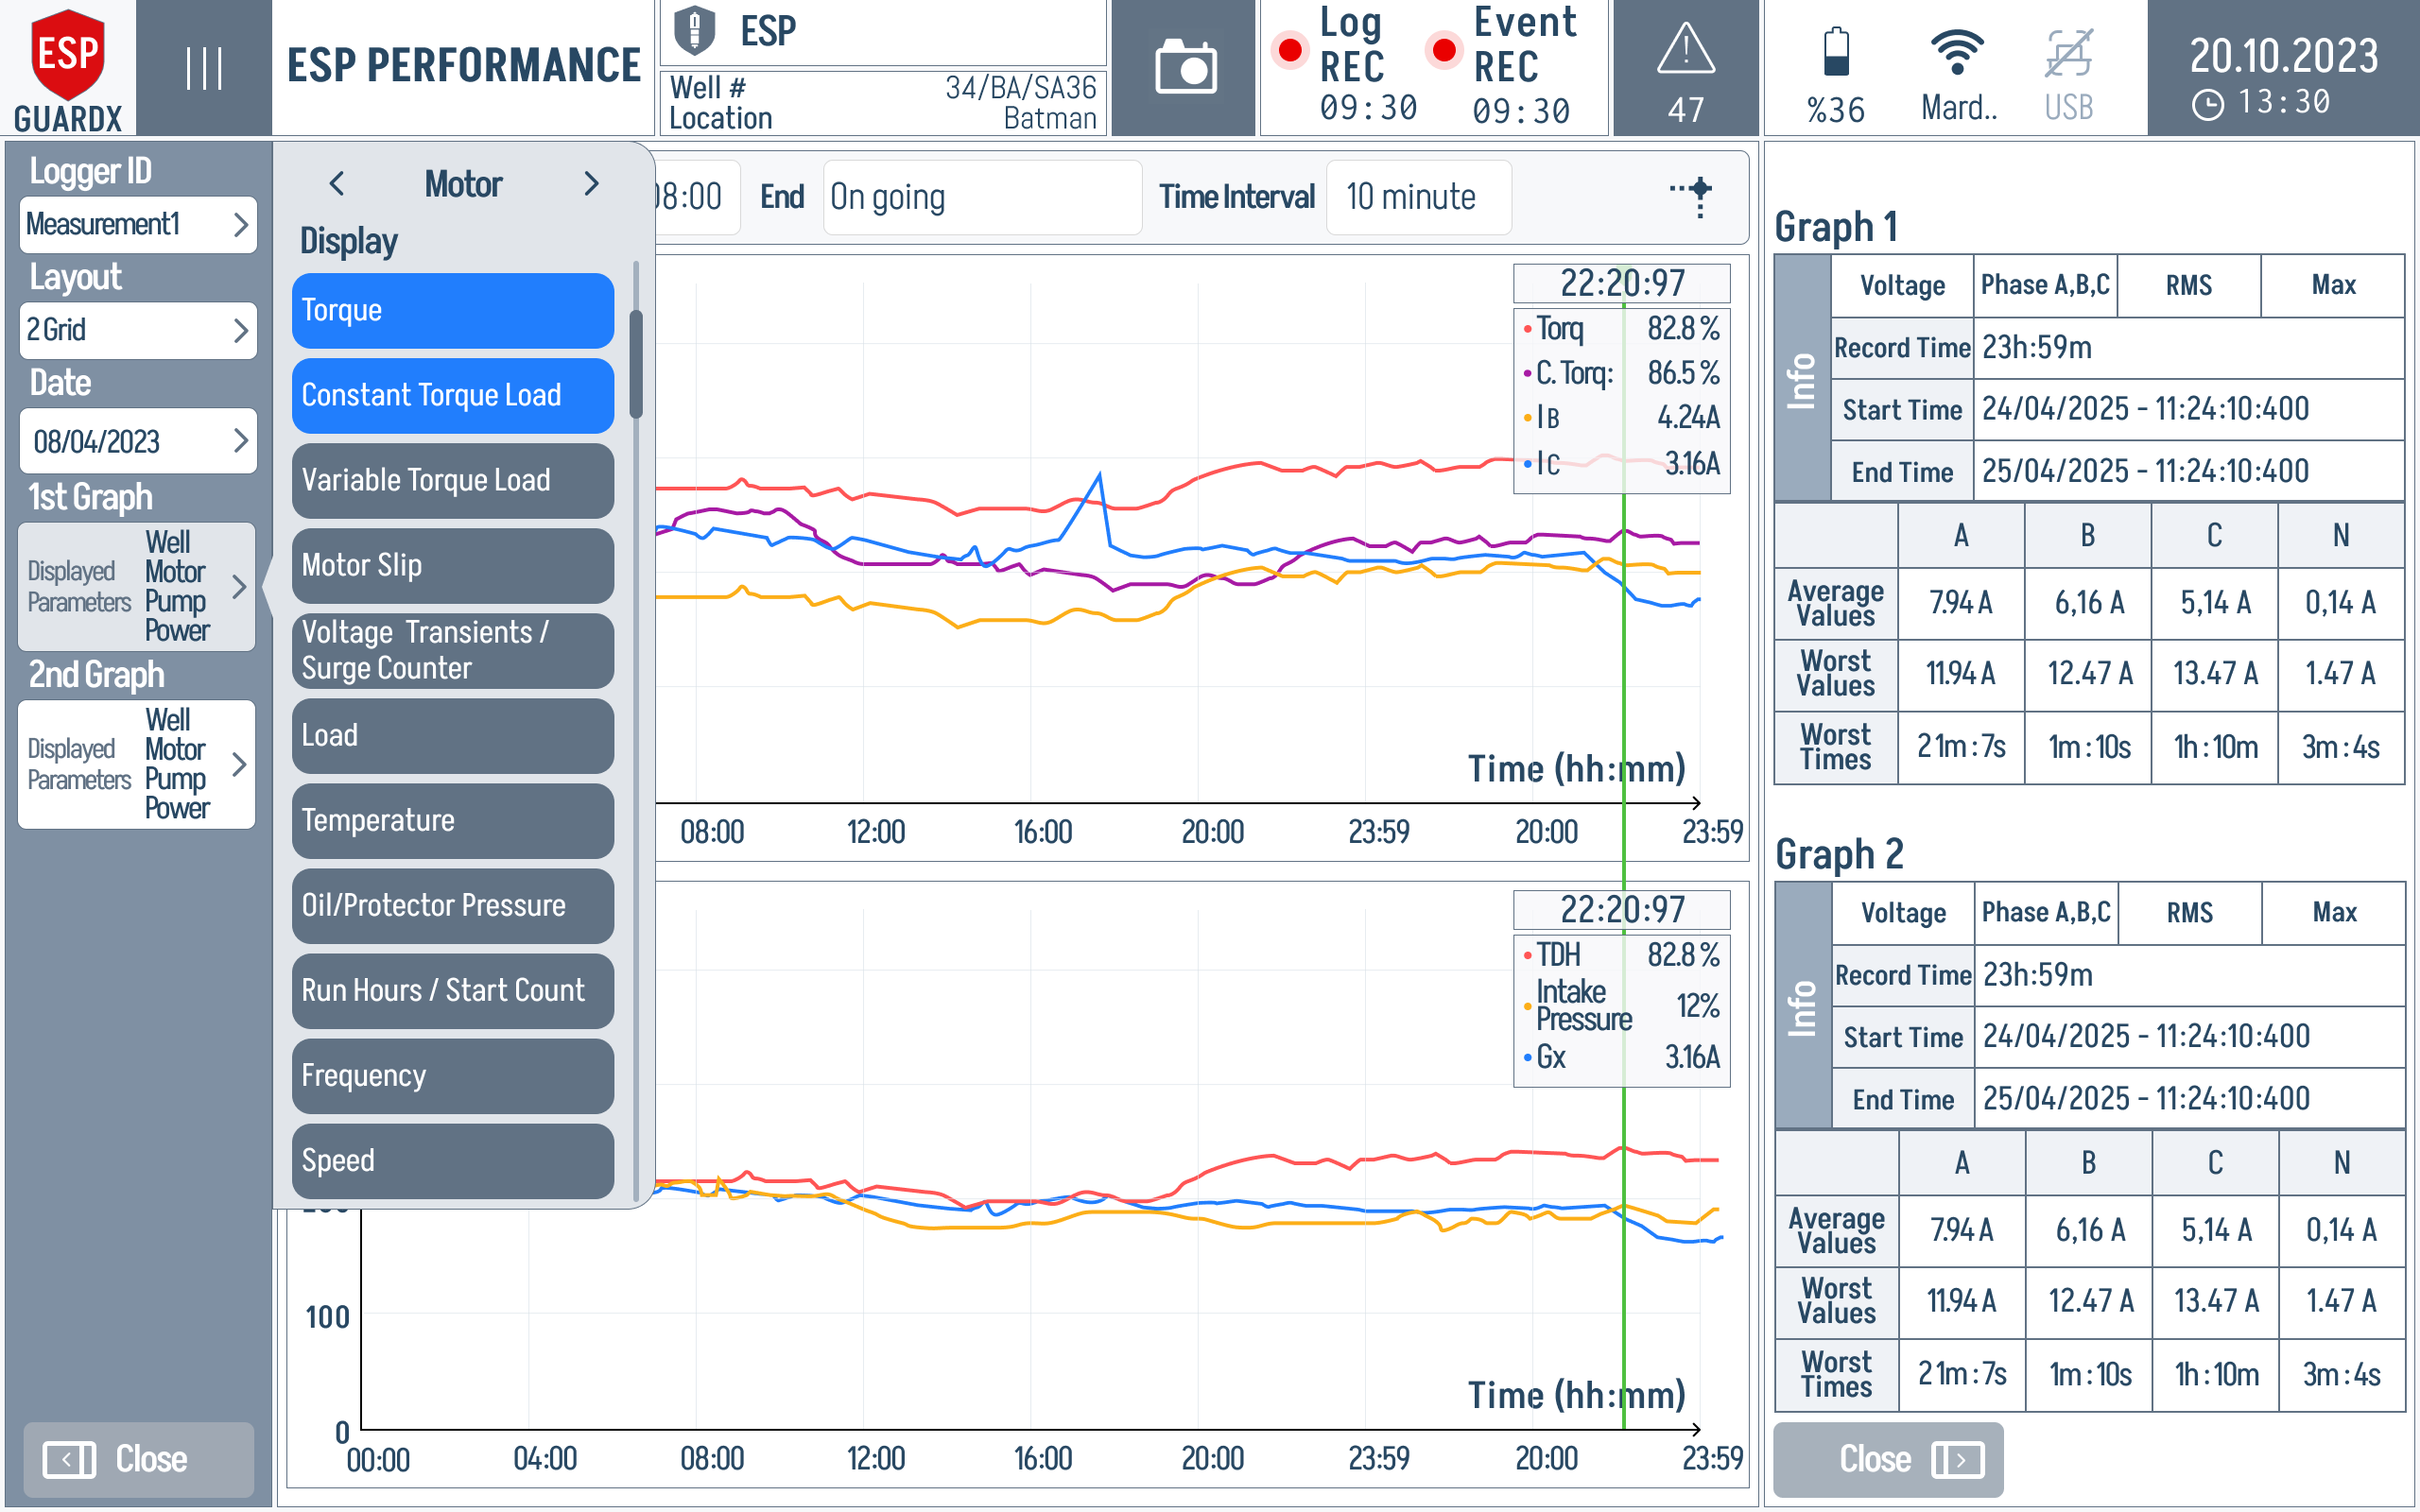
The picker overlays the live graph area, so the operator can change plotted signals without losing the time cursor or the per-graph statistics on the right. Selected items are highlighted in blue; unselected items remain grey.
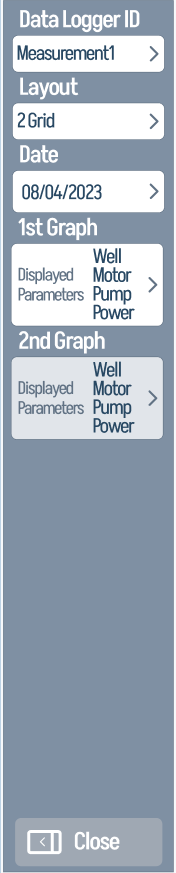
The picker dialog itself, zoomed:
Layout Selector
The layout selector switches between one and two stacked charts, or a full-screen view. The selector itself is shown below:
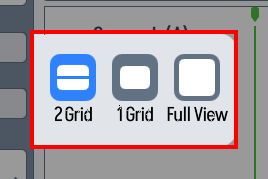
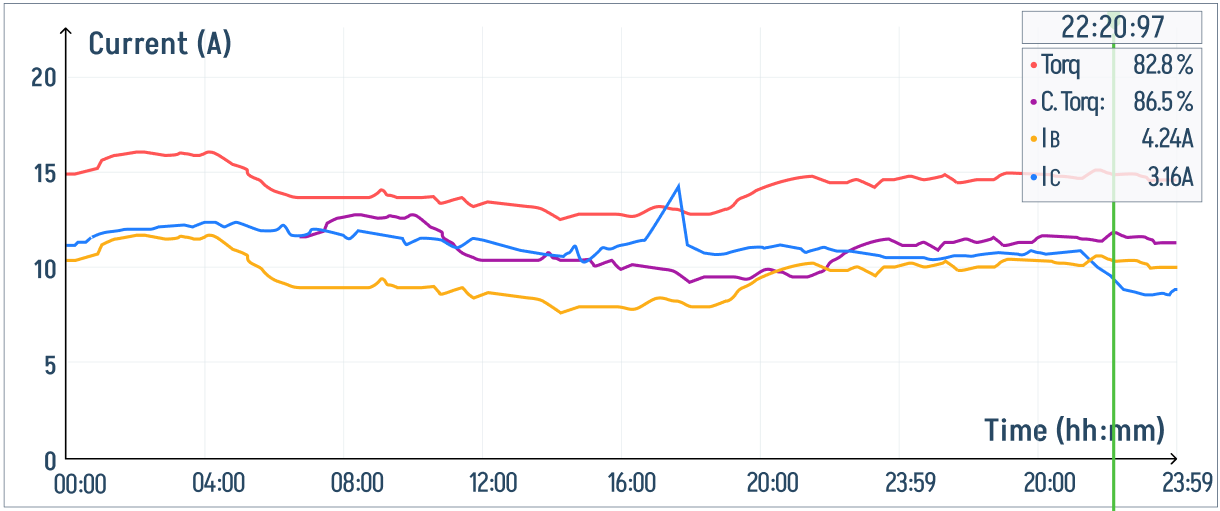
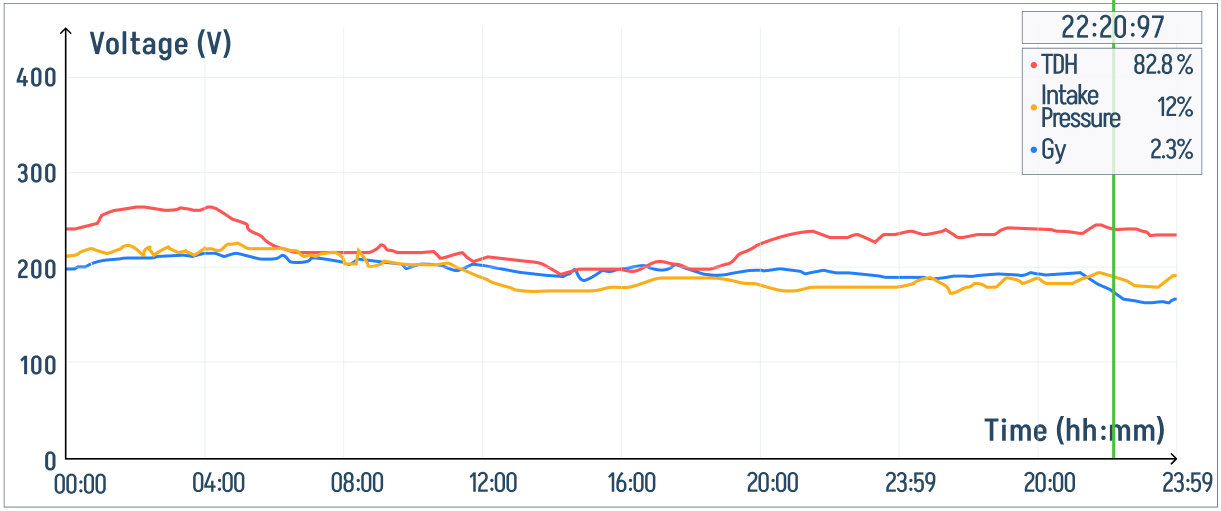
The 2 Grid layout stacks two charts vertically so you can correlate two parameters against a shared time axis. The populated example below compares phase current against phase voltage over the same one-day recording window:
The same layout broken into its working zones:
Left controls (logger / layout / date / parameters / Close):
Top time controls (Start / End / Time Interval):

Graph 1 (top chart) and Graph 2 (bottom chart):
Right info column (Graph 1 + Graph 2 info cards):
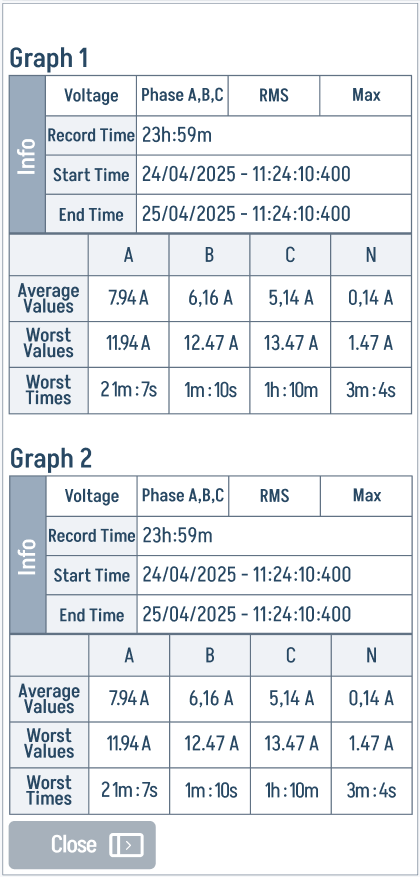
Per-Graph Info Panel
Each chart has its own info card on the right that reports:
- Voltage / Phase / RMS / Max reference row
- Record Time (duration covered)
- Start Time and End Time of the currently rendered window
This makes it easy to confirm you're looking at the correct window when comparing historical events.