Power Measurements
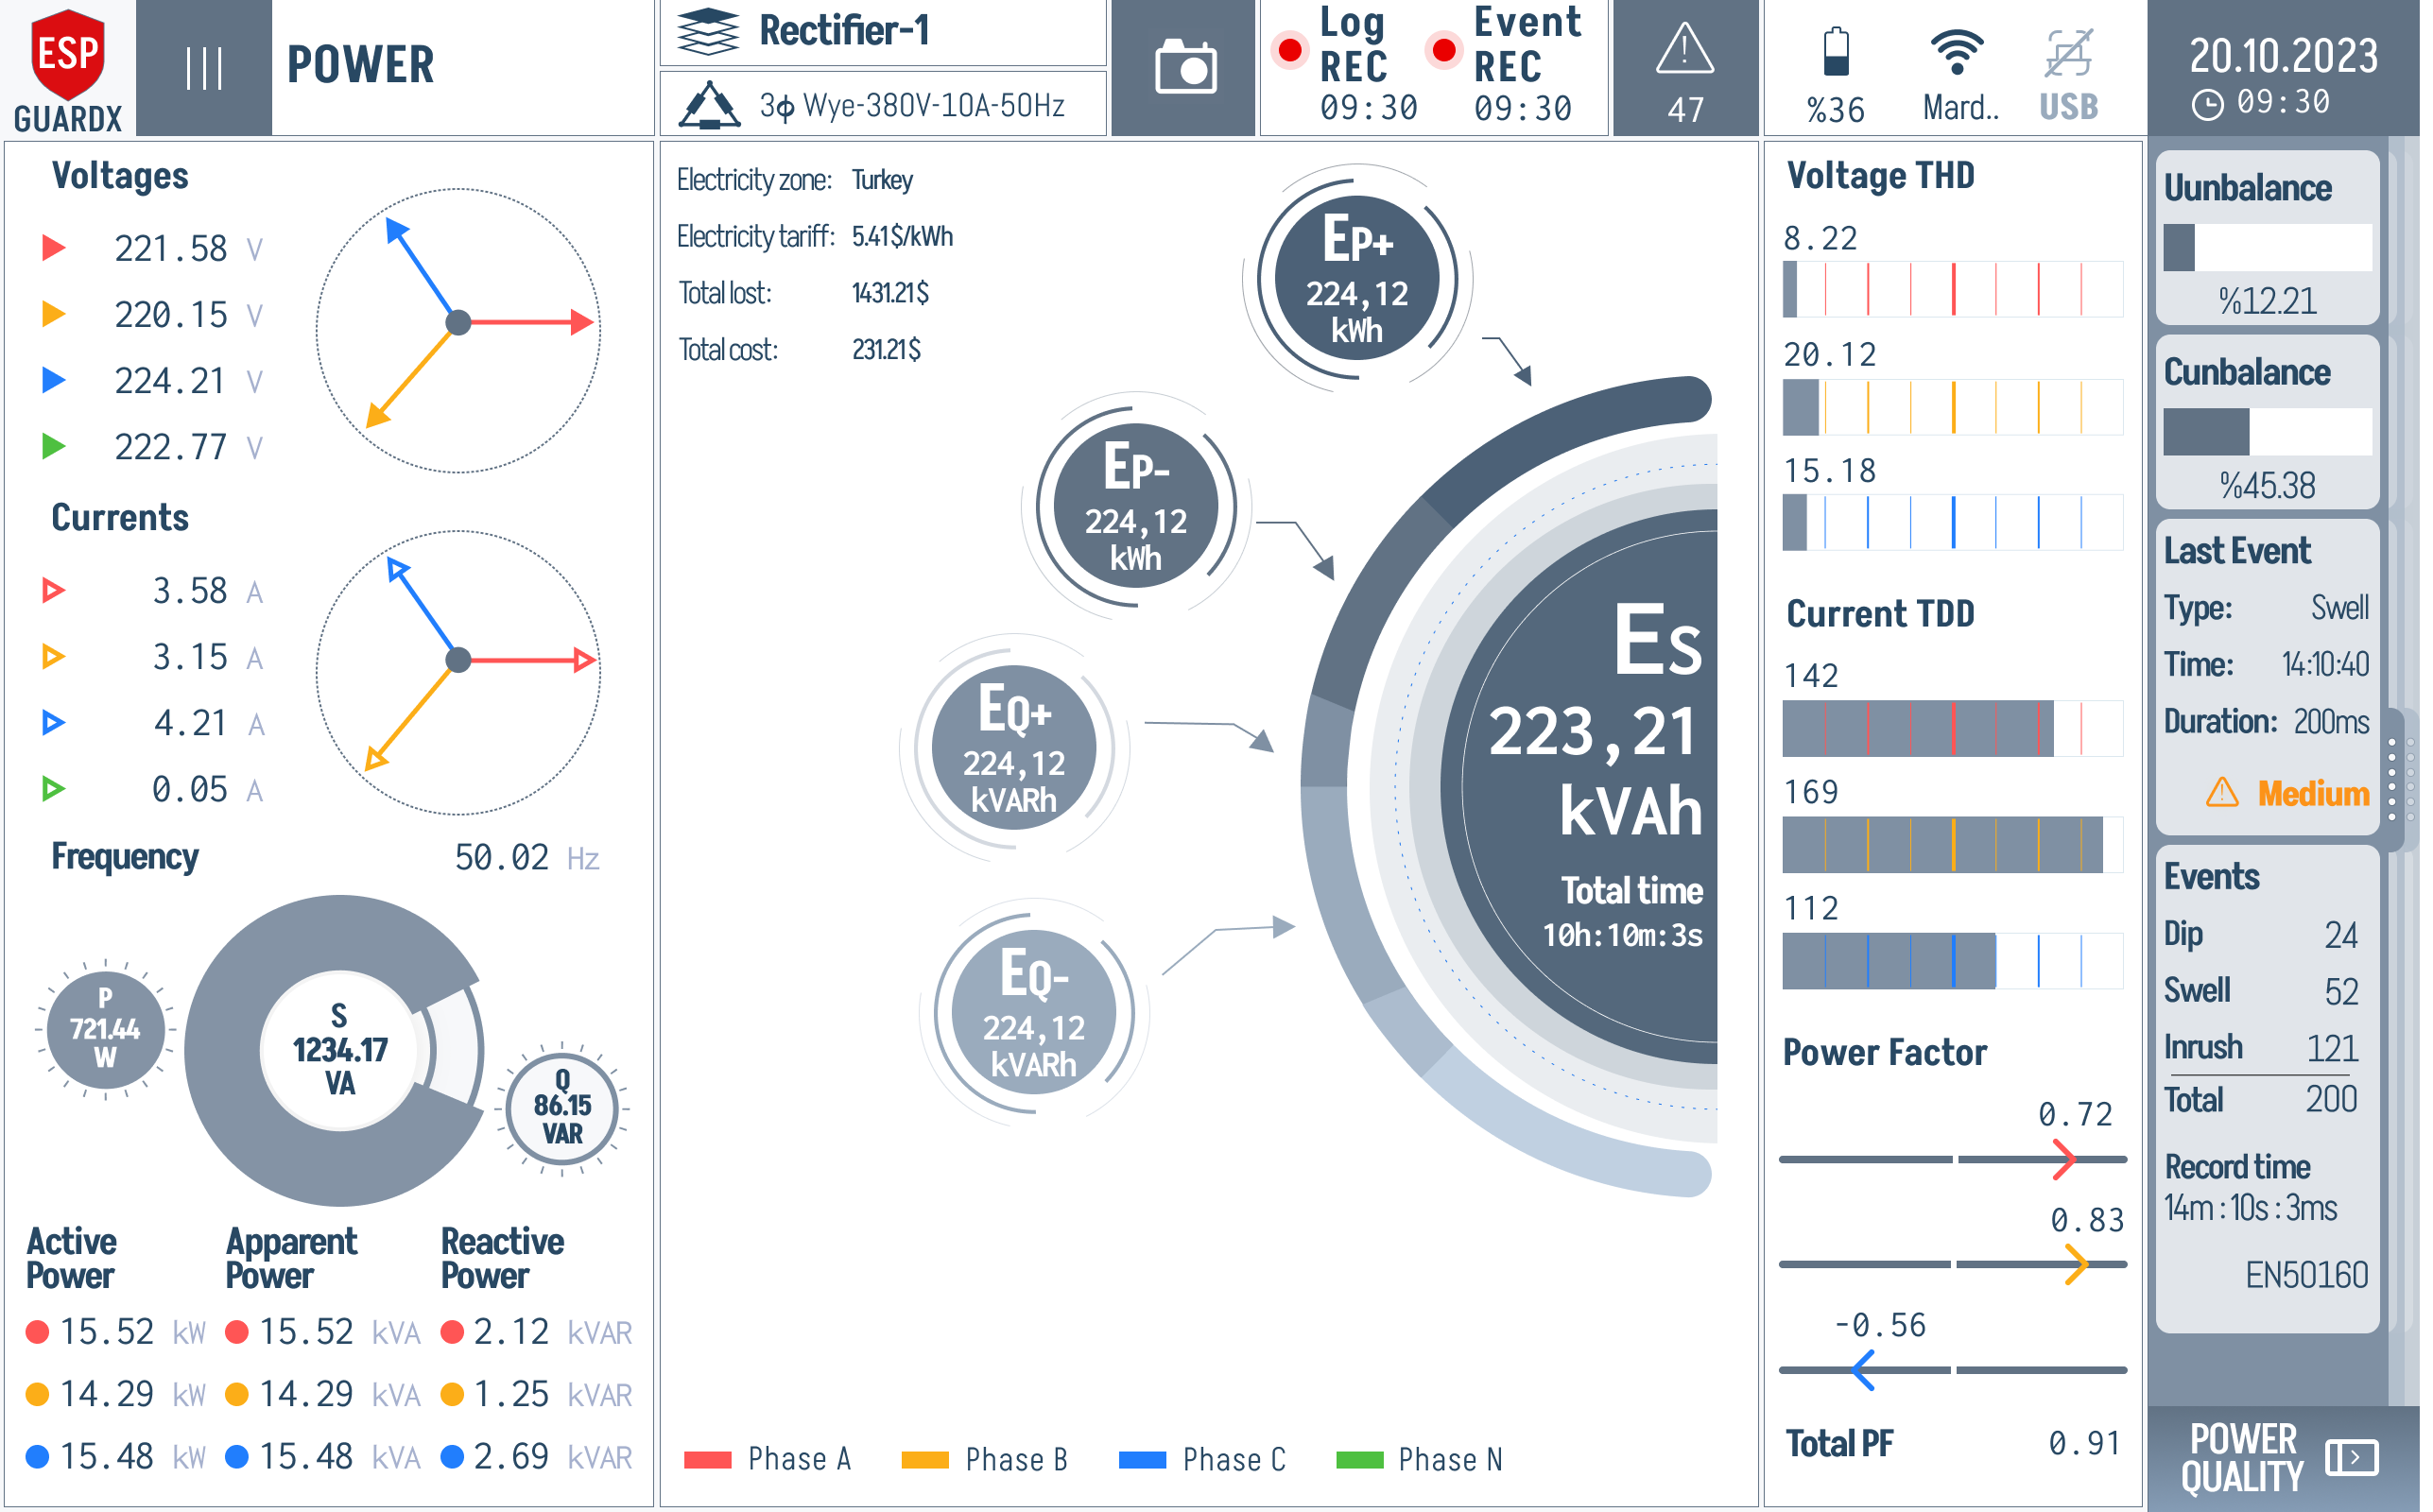
The Power screen is the high-density "everything electrical" view — phasors, P/S/Q, cumulative energy, harmonics, unbalance, recent power-quality events, and power factor all on one page. Access it from the Status tab in the navigation sidebar.
Reading the Power Screen
The screen is organised in four columns. Read them in order — left first (raw input), then centre (energy use), then right (quality & events).
The left column stacks four blocks vertically:
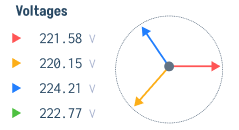
Voltages (top) — V Phase A / B / C circles with the live phasor diagram.
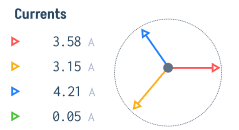
Currents (upper-middle) — I Phase A / B / C circles with the matching current phasor.
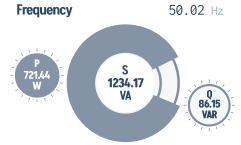
Frequency + P / S / Q gauges (lower-middle) — system frequency on the left and the active / apparent / reactive triple gauge on the right.
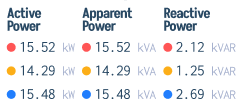
Active / Apparent / Reactive Power per phase (bottom) — numeric breakdown per phase with phase-A / B / C / N legend.
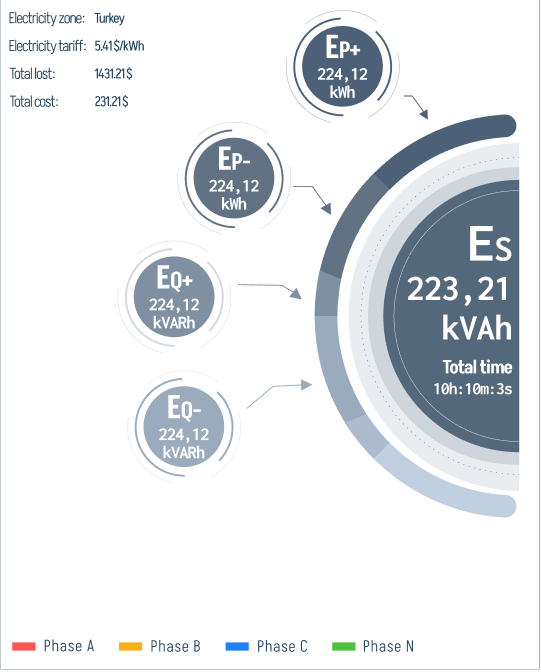
The centre column is the Cumulative Energy display — big animated rings showing Es (apparent), Ep+ (active forward), Ep- (active reverse), in kWh / kVARh / kVAh, plus the on-screen tariff readout (zone, $/kWh, total lost, total cost).
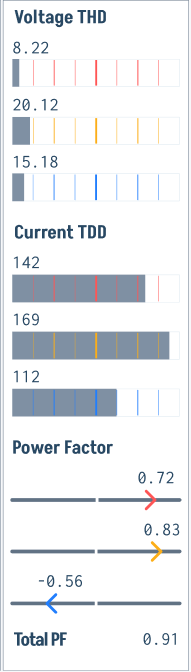
The third column carries Voltage THD / Current TDD / Power Factor — per-phase Total Harmonic Distortion bars, Total Demand Distortion bars, and the per-phase power-factor sliders plus Total PF.
The right column carries Unbalance / Last Event / Events / Record Time — V-unbalance %, I-unbalance %, the most recent power-quality event card, running counts of Dip / Swell / Inrush, and the EN50160 record window.
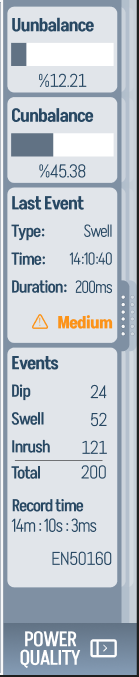
A POWER QUALITY shortcut at the bottom-right jumps straight into the deeper Power Quality screen.

Cumulative Energy Display

The big rings are not just decorative — each one is a running cumulative counter:
- Es (kVAh) — apparent energy, the number that matters for the utility's billing meter.
- Ep+ (kWh) — active energy delivered to the load (motor + losses).
- Ep- (kWh) — active energy returned to the supply (only non-zero in regenerative configurations).
The tariff readout above the rings (Electricity zone, $/kWh, Total lost, Total cost) is computed live from the active-energy counter and the configured tariff — handy for daily site reports without leaving the device.
Per-Phase Quality Strip
The right-hand region (3) gives you a per-phase power-quality snapshot at a glance:
- Voltage THD — three horizontal bars, one per phase, against the 5% / 8% warn / trip line. A bar pushed to the right means harmonic content is climbing on that phase.
- Current TDD — same three-phase layout but referenced to full-load current; spikes here usually mean a non-linear load (VFD ringing, switching transients).
If you see one phase consistently higher than the others on either bar group, that phase is your culprit — go to Waveforms / Harmonics to see the offending harmonic order.
Displayed Parameters
Voltage Measurements
| Parameter | Description |
|---|---|
| V Phase A | Line-to-neutral voltage, Phase A |
| V Phase B | Line-to-neutral voltage, Phase B |
| V Phase C | Line-to-neutral voltage, Phase C |
| V Average | Average of all three phases |
| V Unbalance (%) | Percentage difference between phases |
Current Measurements
| Parameter | Description |
|---|---|
| I Phase A | Current through Phase A |
| I Phase B | Current through Phase B |
| I Phase C | Current through Phase C |
| I Average | Average of all three phases |
| I Unbalance (%) | Percentage difference between phases |
Power Measurements
| Parameter | Unit | Description |
|---|---|---|
| Active Power | kW | Real power consumed by the load |
| Reactive Power | kVAR | Reactive power component |
| Apparent Power | kVA | Total power (vector sum of active and reactive) |
| Power Factor | -- | Ratio of active to apparent power (0 to 1) |
| Total Power Factor | -- | Displacement plus distortion power factor |
Energy Measurements
| Parameter | Unit | Description |
|---|---|---|
| Active Energy | kWh | Cumulative real energy consumed |
| Reactive Energy | kVARh | Cumulative reactive energy |
| Apparent Energy | kVAh | Cumulative apparent energy |
Frequency
| Parameter | Unit | Description |
|---|---|---|
| Frequency | Hz | System frequency (30--400 Hz range supported for VFD-driven ESPs) |
Phasor Display
The Power screen includes a phasor diagram showing the angular relationship between voltage and current vectors for all three phases. This helps identify:
- Phase sequence (forward or reverse rotation)
- Power factor angle
- Phase unbalance conditions
For the visible phasor diagrams, refer to the Voltages and Currents blocks near the top of this page.
Sequence Components
ESP-GUARDX calculates symmetrical sequence components:
- Positive Sequence -- Represents balanced forward-rotating component
- Negative Sequence -- Indicates phase unbalance; high values suggest wiring issues or supply problems
- Zero Sequence -- Indicates ground fault conditions