Pump Performance
The Pump screen lets you compare the pump's as-designed performance curves against its live operating point and condition flags. Access it from the Pump tab in the navigation sidebar.
Reading the Pump Screen
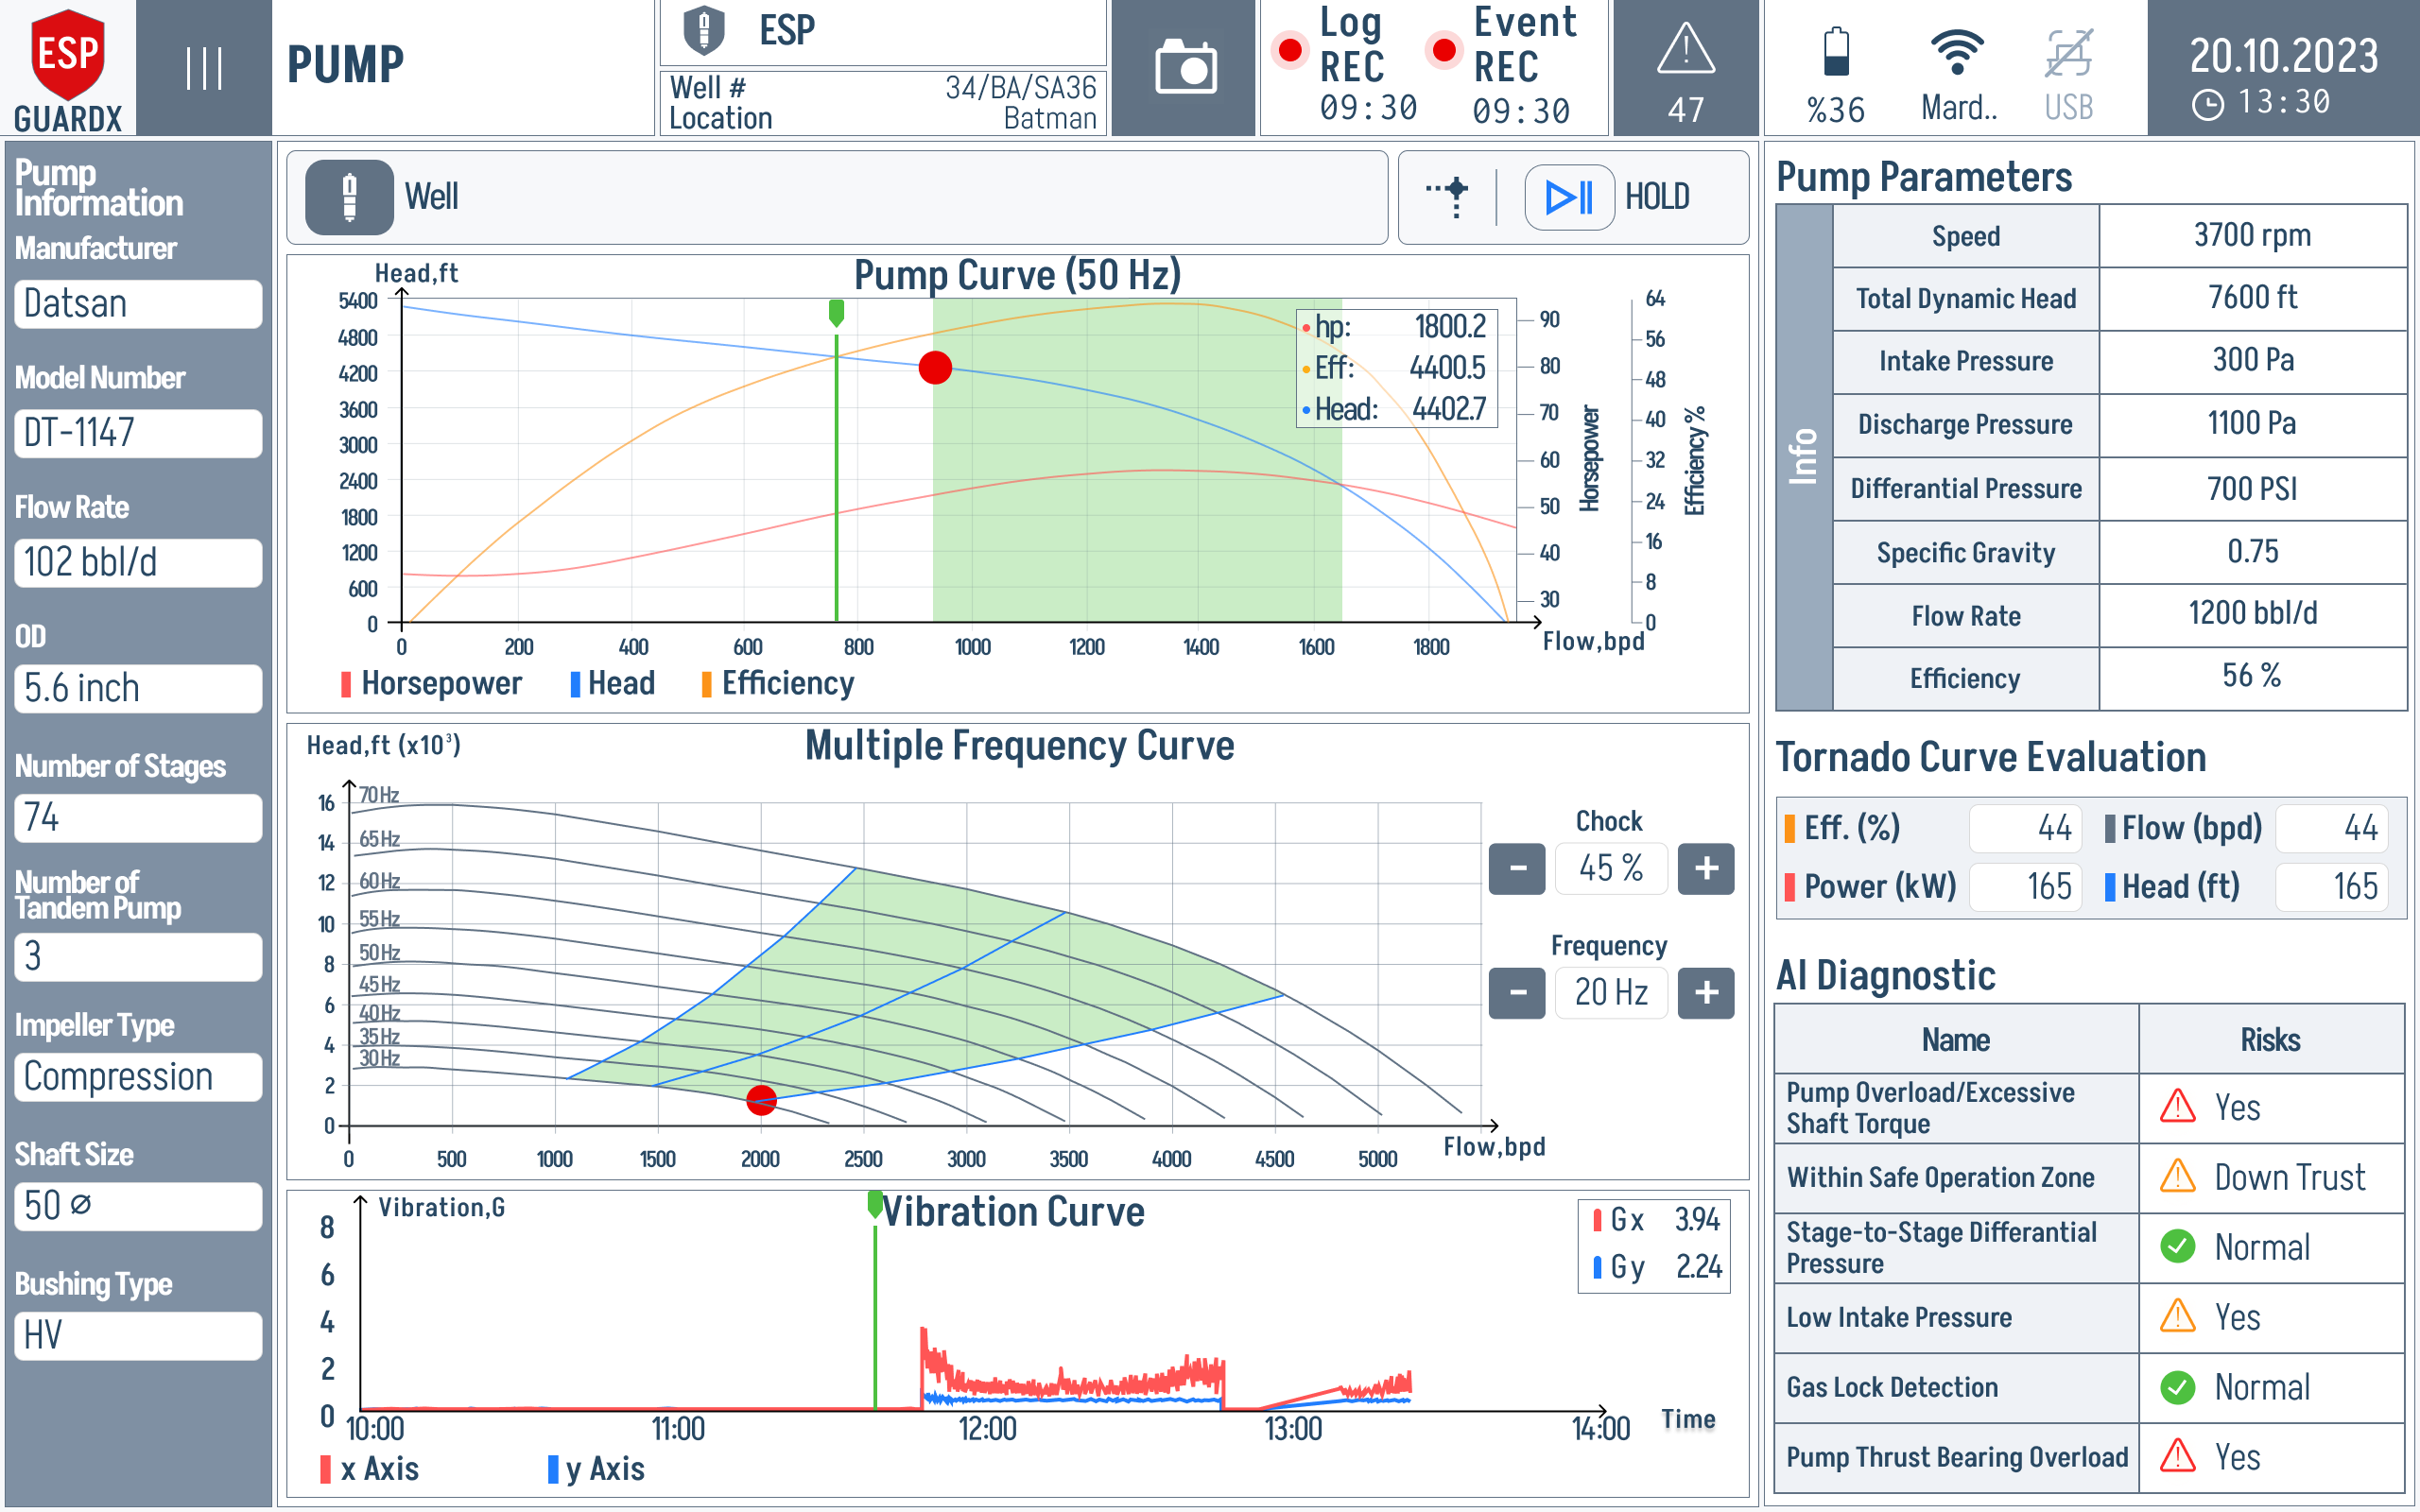
The screen has four working areas. The two charts on the left are the pump's design curves; the two panels on the right are what the pump is actually doing right now.
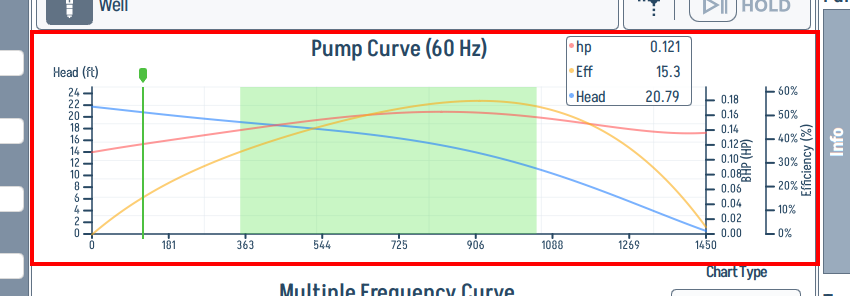
Pump Curve (60 Hz) — Head, Efficiency, BHP curves at the selected base frequency. The live operating point is plotted on top.
The red operating-point dot is the first thing to check. If it sits outside the green operating band, use the Tornado Curve Evaluation panel on the right to see whether the condition is being classified as overload, downthrust, low intake pressure, or another pump-side risk.
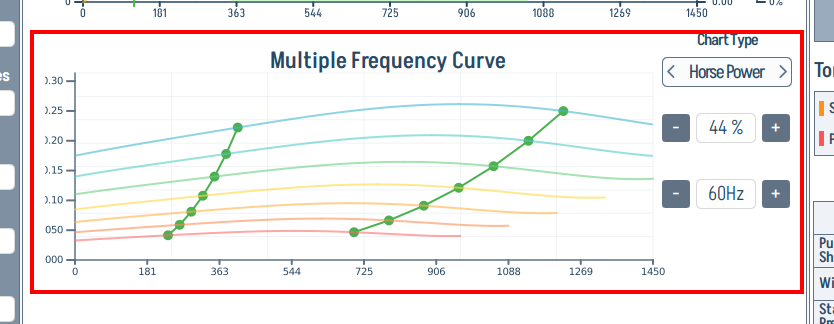
Multiple Frequency Curve — the same family of curves redrawn for several VFD frequencies side-by-side, using the Affinity Laws (see below).
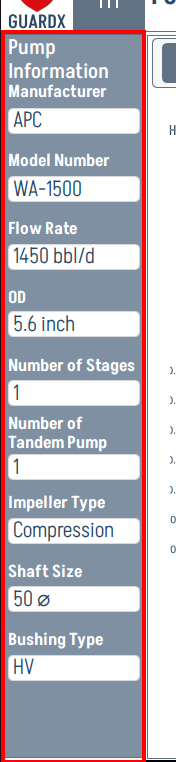
Pump Information sidebar (left) — pump model, manufacturer, flow rate, OD, number of stages, tandem count, impeller type, shaft size, bushing type. The reference values that drive the curves on the right.
Pump Parameters (right top) — live numeric panel: Speed, Total Dynamic Head, Intake Pressure (Pintake), Discharge Pressure (Pdischarge), pressure difference / drawdown where configured, Flow Rate (Qflow), and efficiency ratio (Reff).
Tornado Curve Evaluation (right bottom) — per-fault status table (Pump Overload / Excessive Shaft Torque, Within Safe Operation Zone, Stage-to-Stage Differential Pressure, Low Intake Pressure, Gas Lock Detection, Pump Thrust Bearing Overload).
Live Pump Parameters
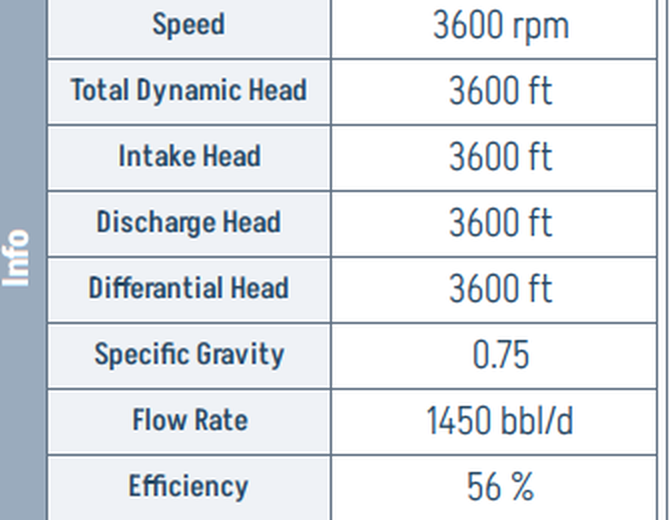
These are the same numbers feeding the operating-point dot on the curves; if you cannot trust this panel, you cannot trust the chart either. Compare Flow Rate (Qflow) and TDH against the curve to spot a pump that is producing less head than it should at a given flow — early warning of stage wear or partial blockage. For the approved source variables and formulas, see Production and Well Parameters.
Tornado Curve Evaluation
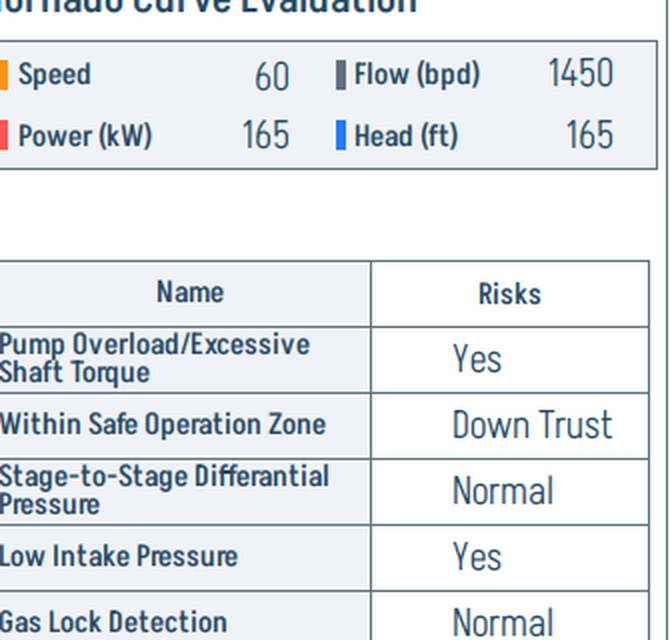
This is the pump-side equivalent of the Motor screen's AI alerts. Each row maps to a pump fault mode and the right column reports the live status:
- Yes — the fault signature is being detected.
- Down Trust / Up Trust — the operating point is bumping the relevant thrust limit (see "Safe Operating Region" below).
- Normal — within tolerance.
Use it as the first place to look when efficiency drops or vibration creeps up.
Pump Performance Curves
ESP-GUARDX displays three primary pump performance curves stacked in the Pump Curve panel:
1. Head vs. Flow Rate
Shows the pressure (head) the pump can generate at different flow rates. Head decreases as flow rate increases — the classic pump curve droop.
2. Efficiency vs. Flow Rate
Shows the pump's hydraulic efficiency across its operating range. The peak of this curve is the Best Efficiency Point (BEP) — the ideal place to operate.
3. Brake Horsepower (BHP) vs. Flow Rate
Shows the power required to drive the pump at different flow rates.
All three curves are calculated using 5th-order polynomial coefficients specific to each pump model, loaded from the pump database — so the curves on screen are the manufacturer's, not a generic approximation.
Multi-Frequency Analysis
ESP motors driven by Variable Frequency Drives (VFDs) can operate at different frequencies. ESP-GUARDX uses the Affinity Laws to calculate pump performance at any frequency between 30 Hz and 400 Hz.
Affinity Laws
The affinity laws relate pump performance at one speed to performance at another:
- Flow: Q2 = Q1 x (N2 / N1)
- Head: H2 = H1 x (N2 / N1)^2
- Power: P2 = P1 x (N2 / N1)^3
Where N is the rotational speed (proportional to frequency).
Frequency Selector
Use the frequency selector on the Pump screen to view performance curves at different operating frequencies. The display shows curves for multiple frequencies simultaneously, allowing comparison.
Safe Operating Region
The Pump screen highlights the safe operating region bounded by two critical limits:
DownThrust Limit
The minimum flow rate at which the pump should operate. Operating below this limit causes:
- Downward axial thrust on the pump shaft
- Bearing damage
- Reduced pump life
UpThrust Limit
The maximum flow rate at which the pump should operate. Operating above this limit causes:
- Upward axial thrust on the pump shaft
- Stage damage
- Mechanical failure risk
The safe operating region is displayed as a shaded band between the DownThrust and UpThrust boundaries on the performance curve chart.
Supported Pump Models
ESP-GUARDX includes a database of 80+ pump models from major manufacturers:
| Manufacturer | Example Models |
|---|---|
| APC | WA-900, and others |
| Levare | ESP 338-1500, and others |
| SLB (Schlumberger) | AN900, and others |
Pump data is stored as CSV files containing polynomial coefficients for head, efficiency, and power curves. The pump model is selected in the ESP Configurator.
Monitored Pump Parameters
| Parameter | Description | Default Warn | Default Trip |
|---|---|---|---|
| Low Intake Pressure | Suction pressure too low | 15% | 25% |
| Discharge Pressure | Discharge pressure deviation | 10% | 20% |
| Low Flow Rate | Flow below minimum | 5% | 15% |
| Pump Efficiency Drop | Efficiency degradation | 8% | 12% |
| Excessive Vibration | Mechanical vibration | 10% | 18% |
| Shaft Torque Overload | Excessive shaft torque | 15% | 25% |
| Gas Lock Detection | Gas accumulation in pump | 5% | 10% |
| Intake Temperature | Fluid temperature at intake | 12% | 20% |
See Event Settings to customize these thresholds.