Dashboard
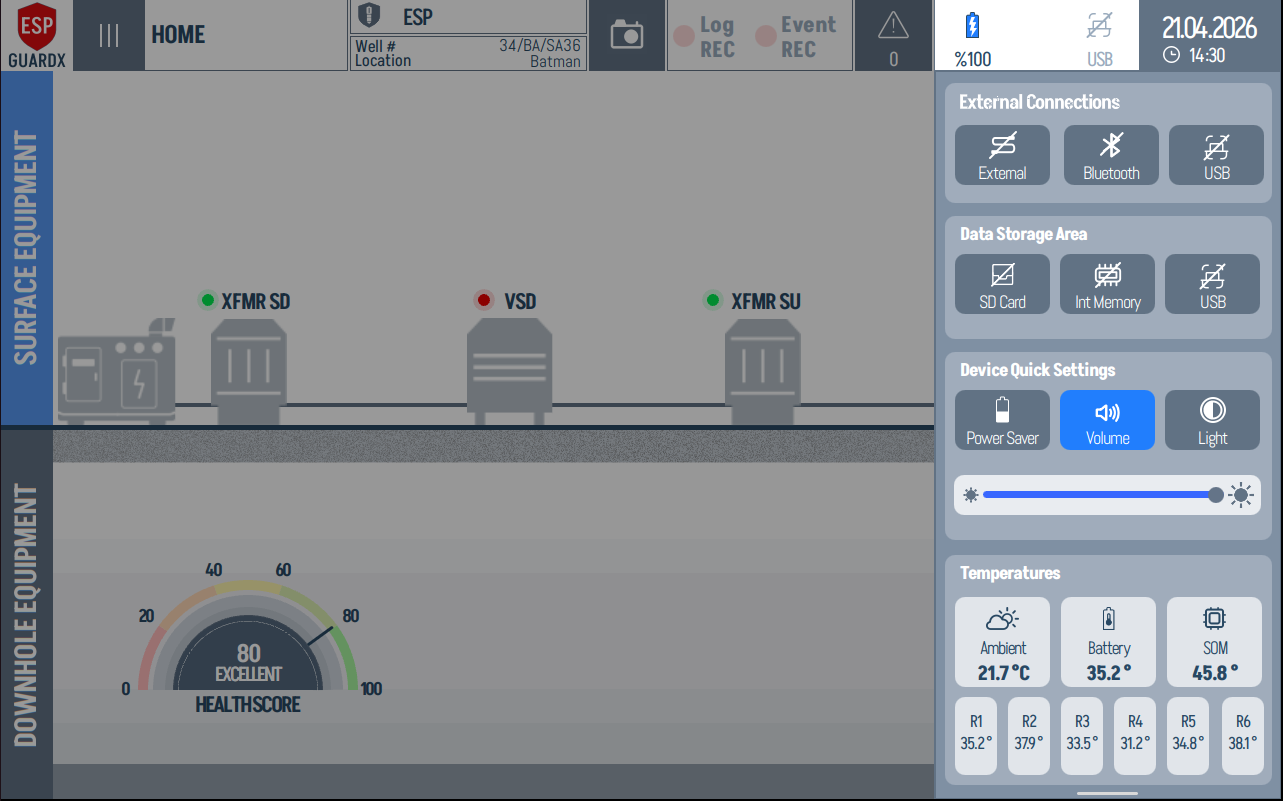
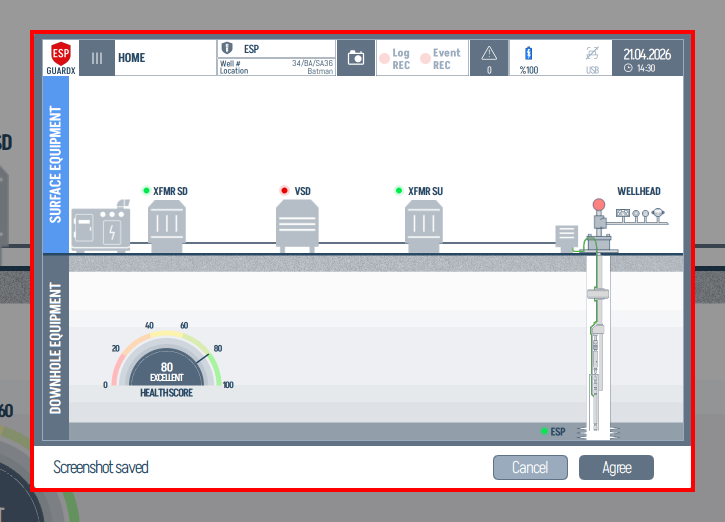
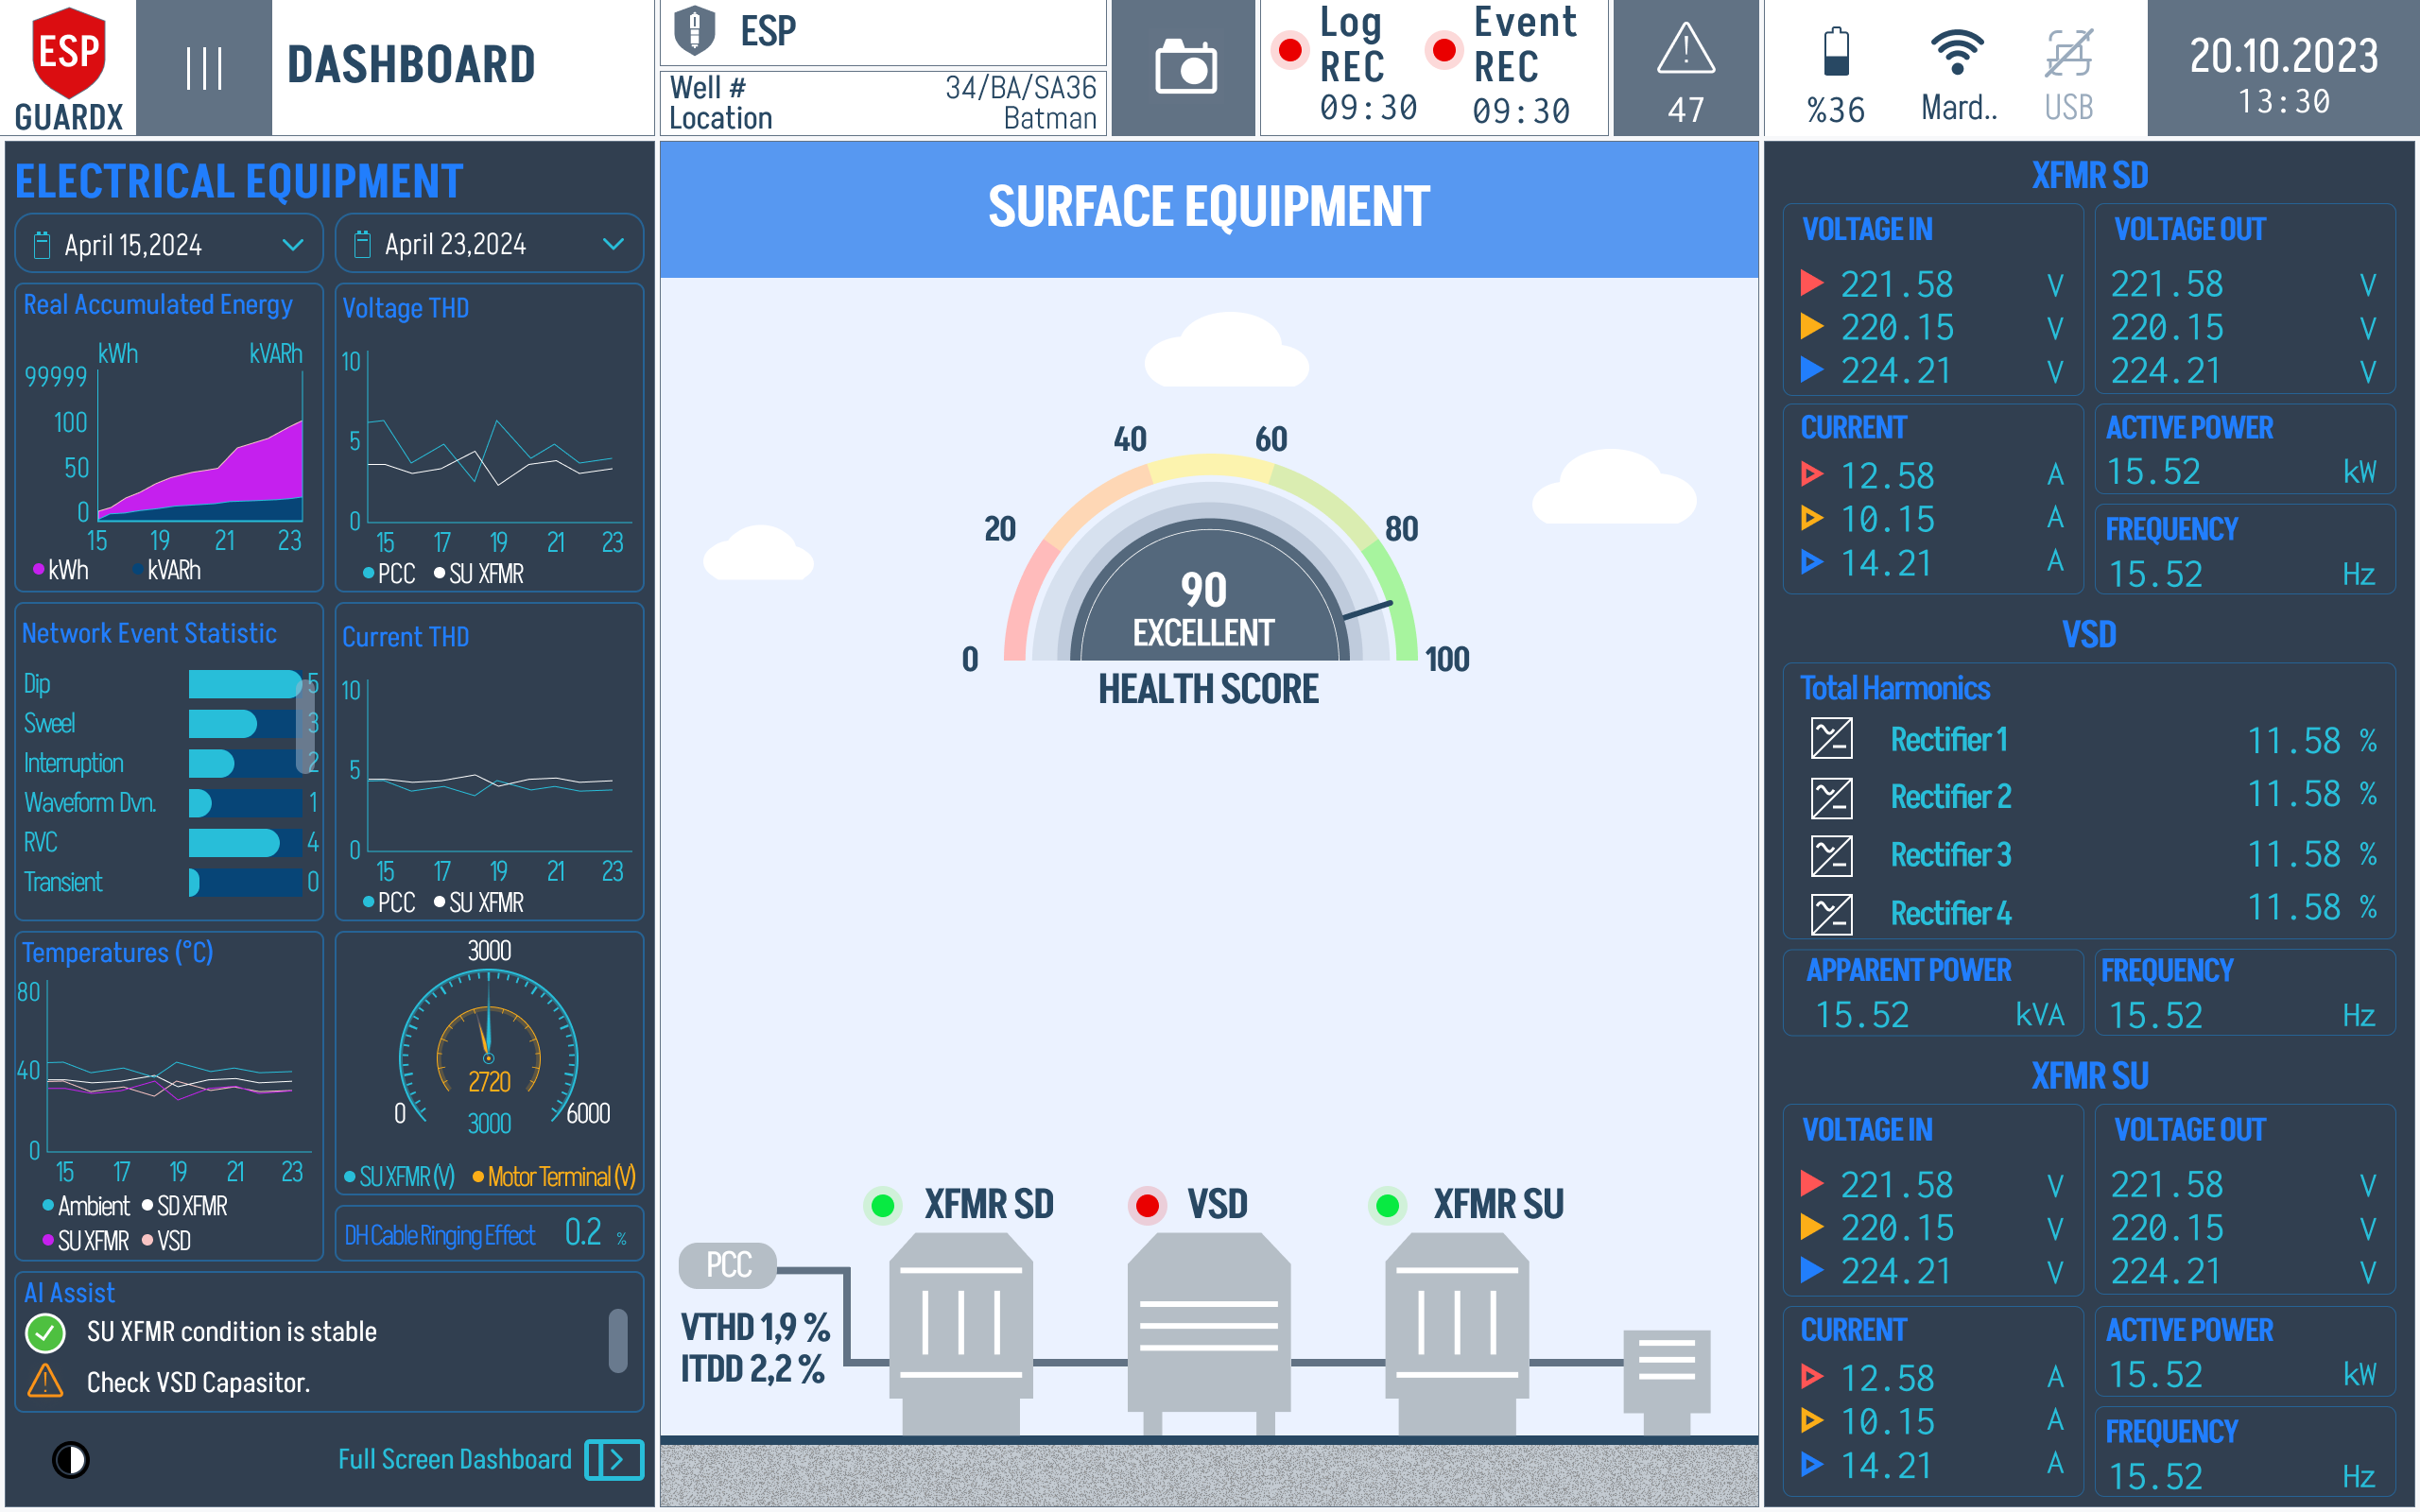
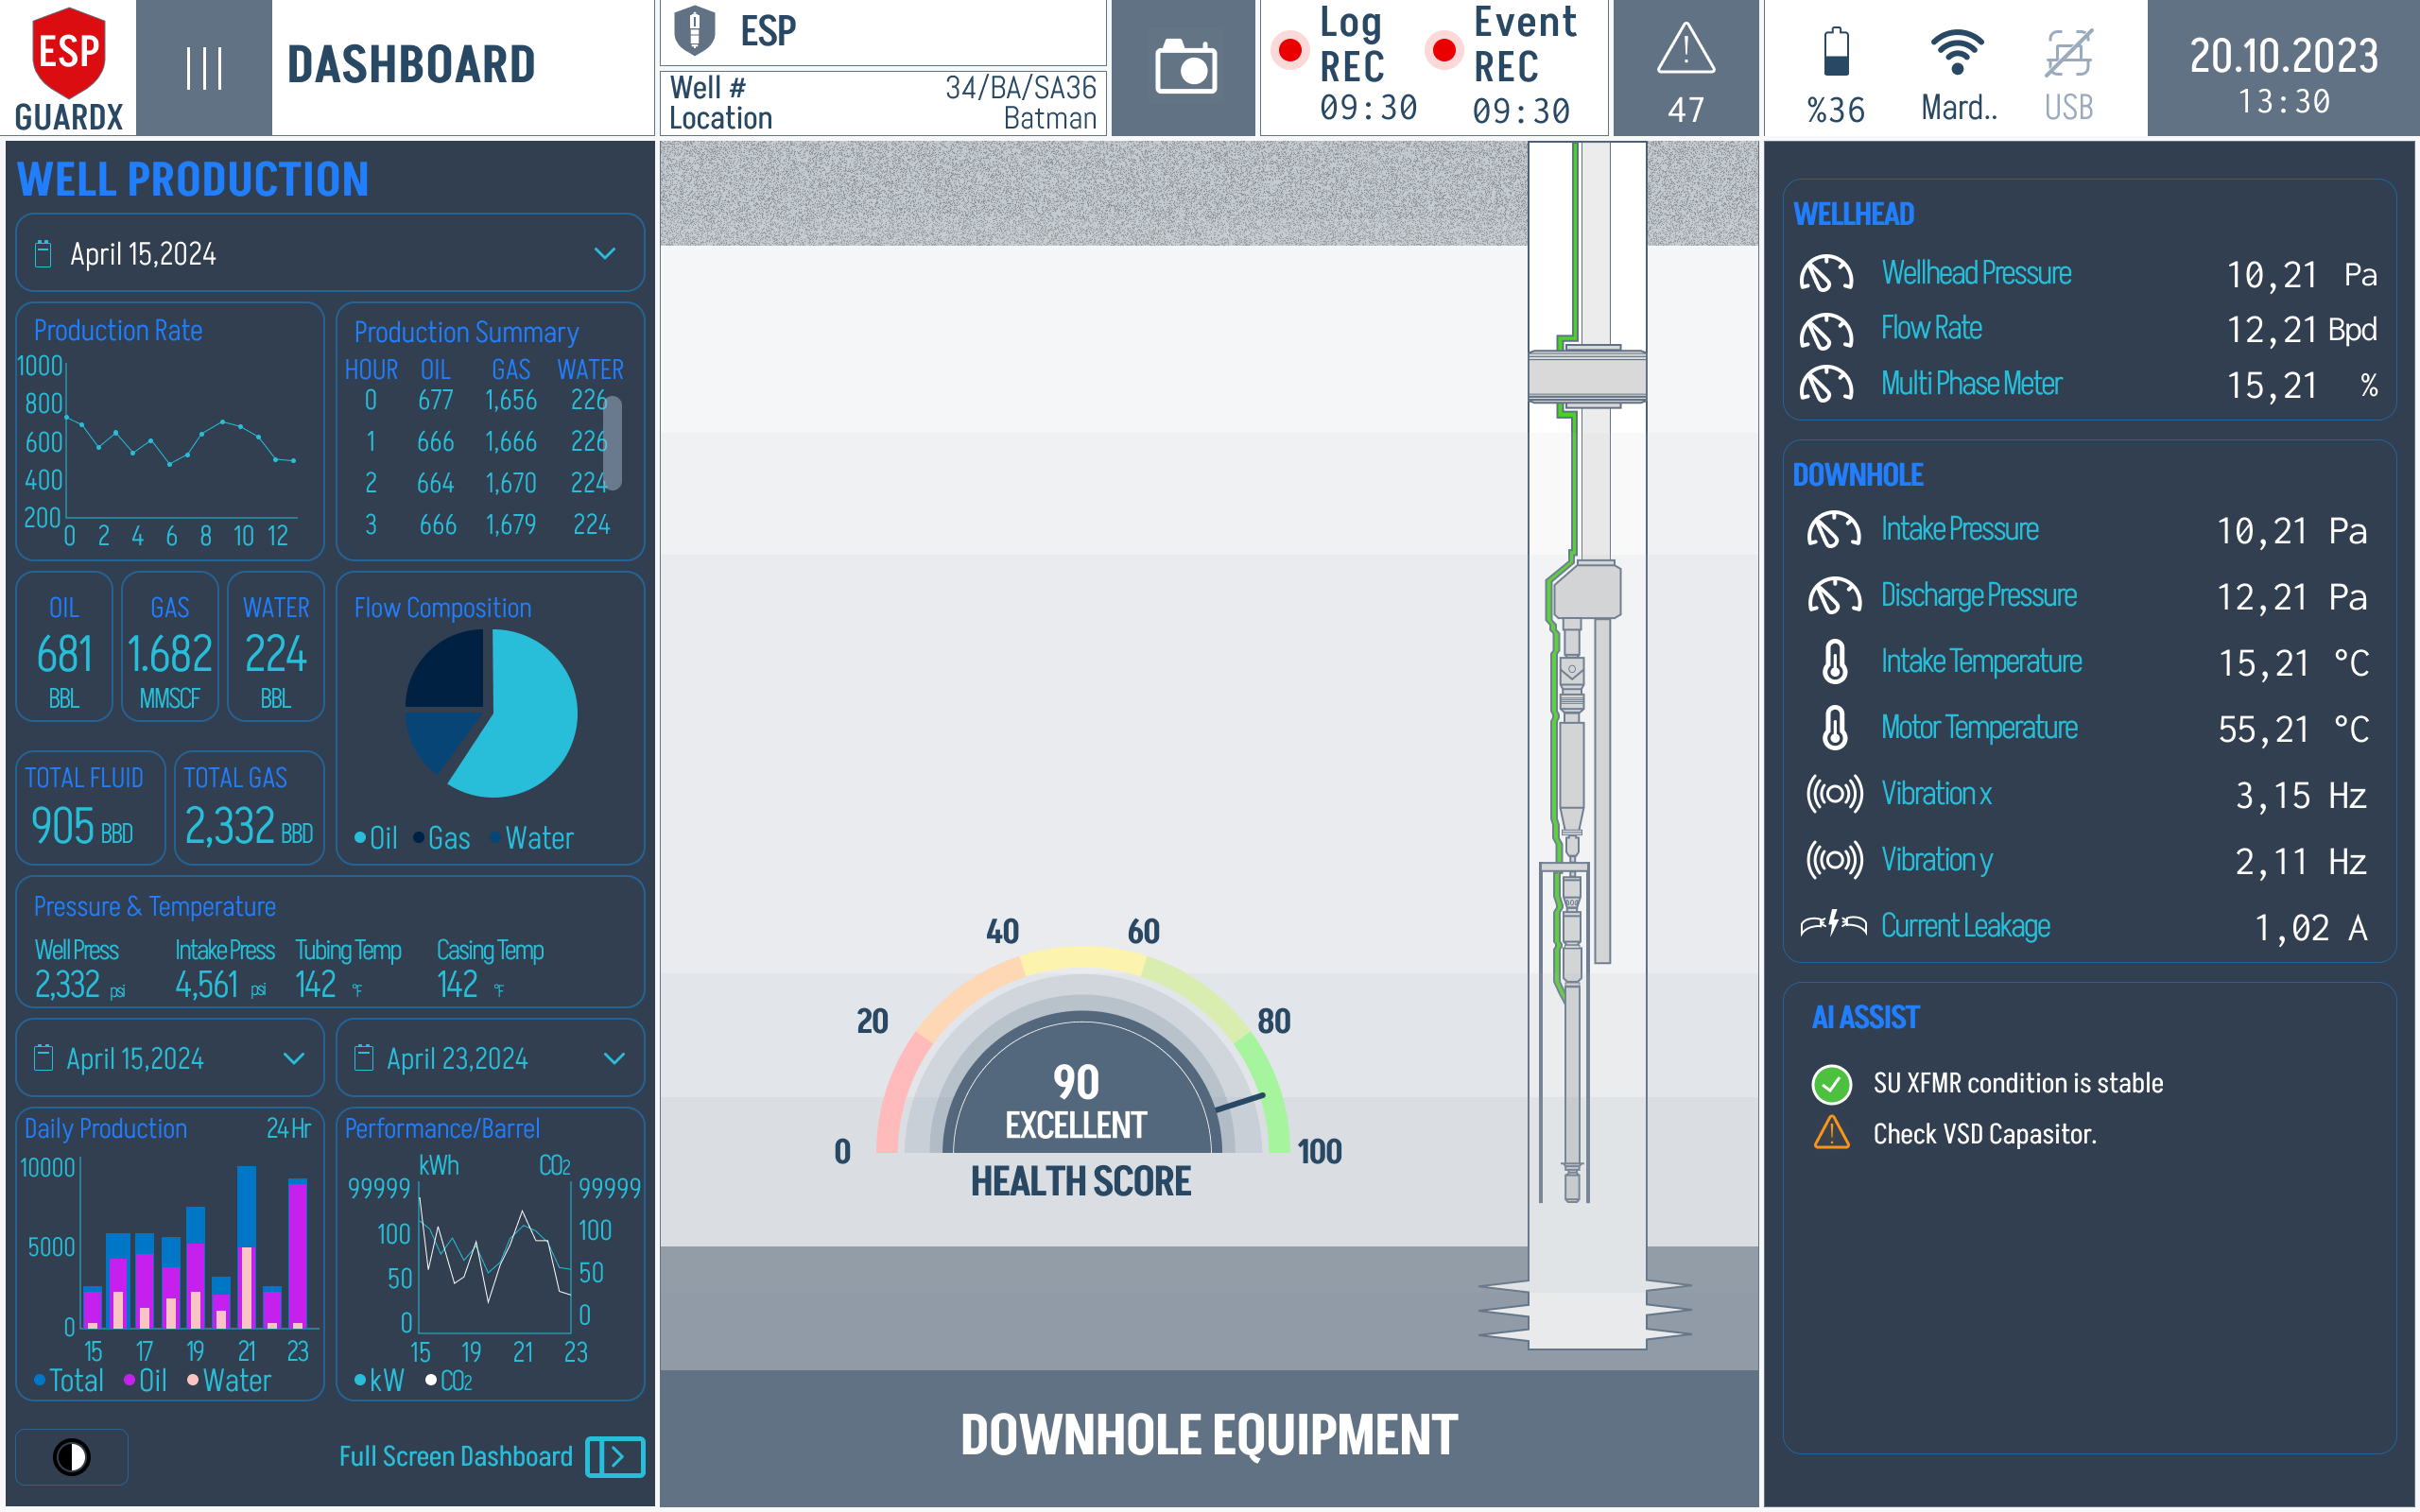
The Dashboard is the main screen of ESP-GUARDX — a single view that lets a field operator answer "is the well healthy right now?" without drilling into any sub-screen. The annotated screenshot below points out the three things you should read every time you walk up to the device.
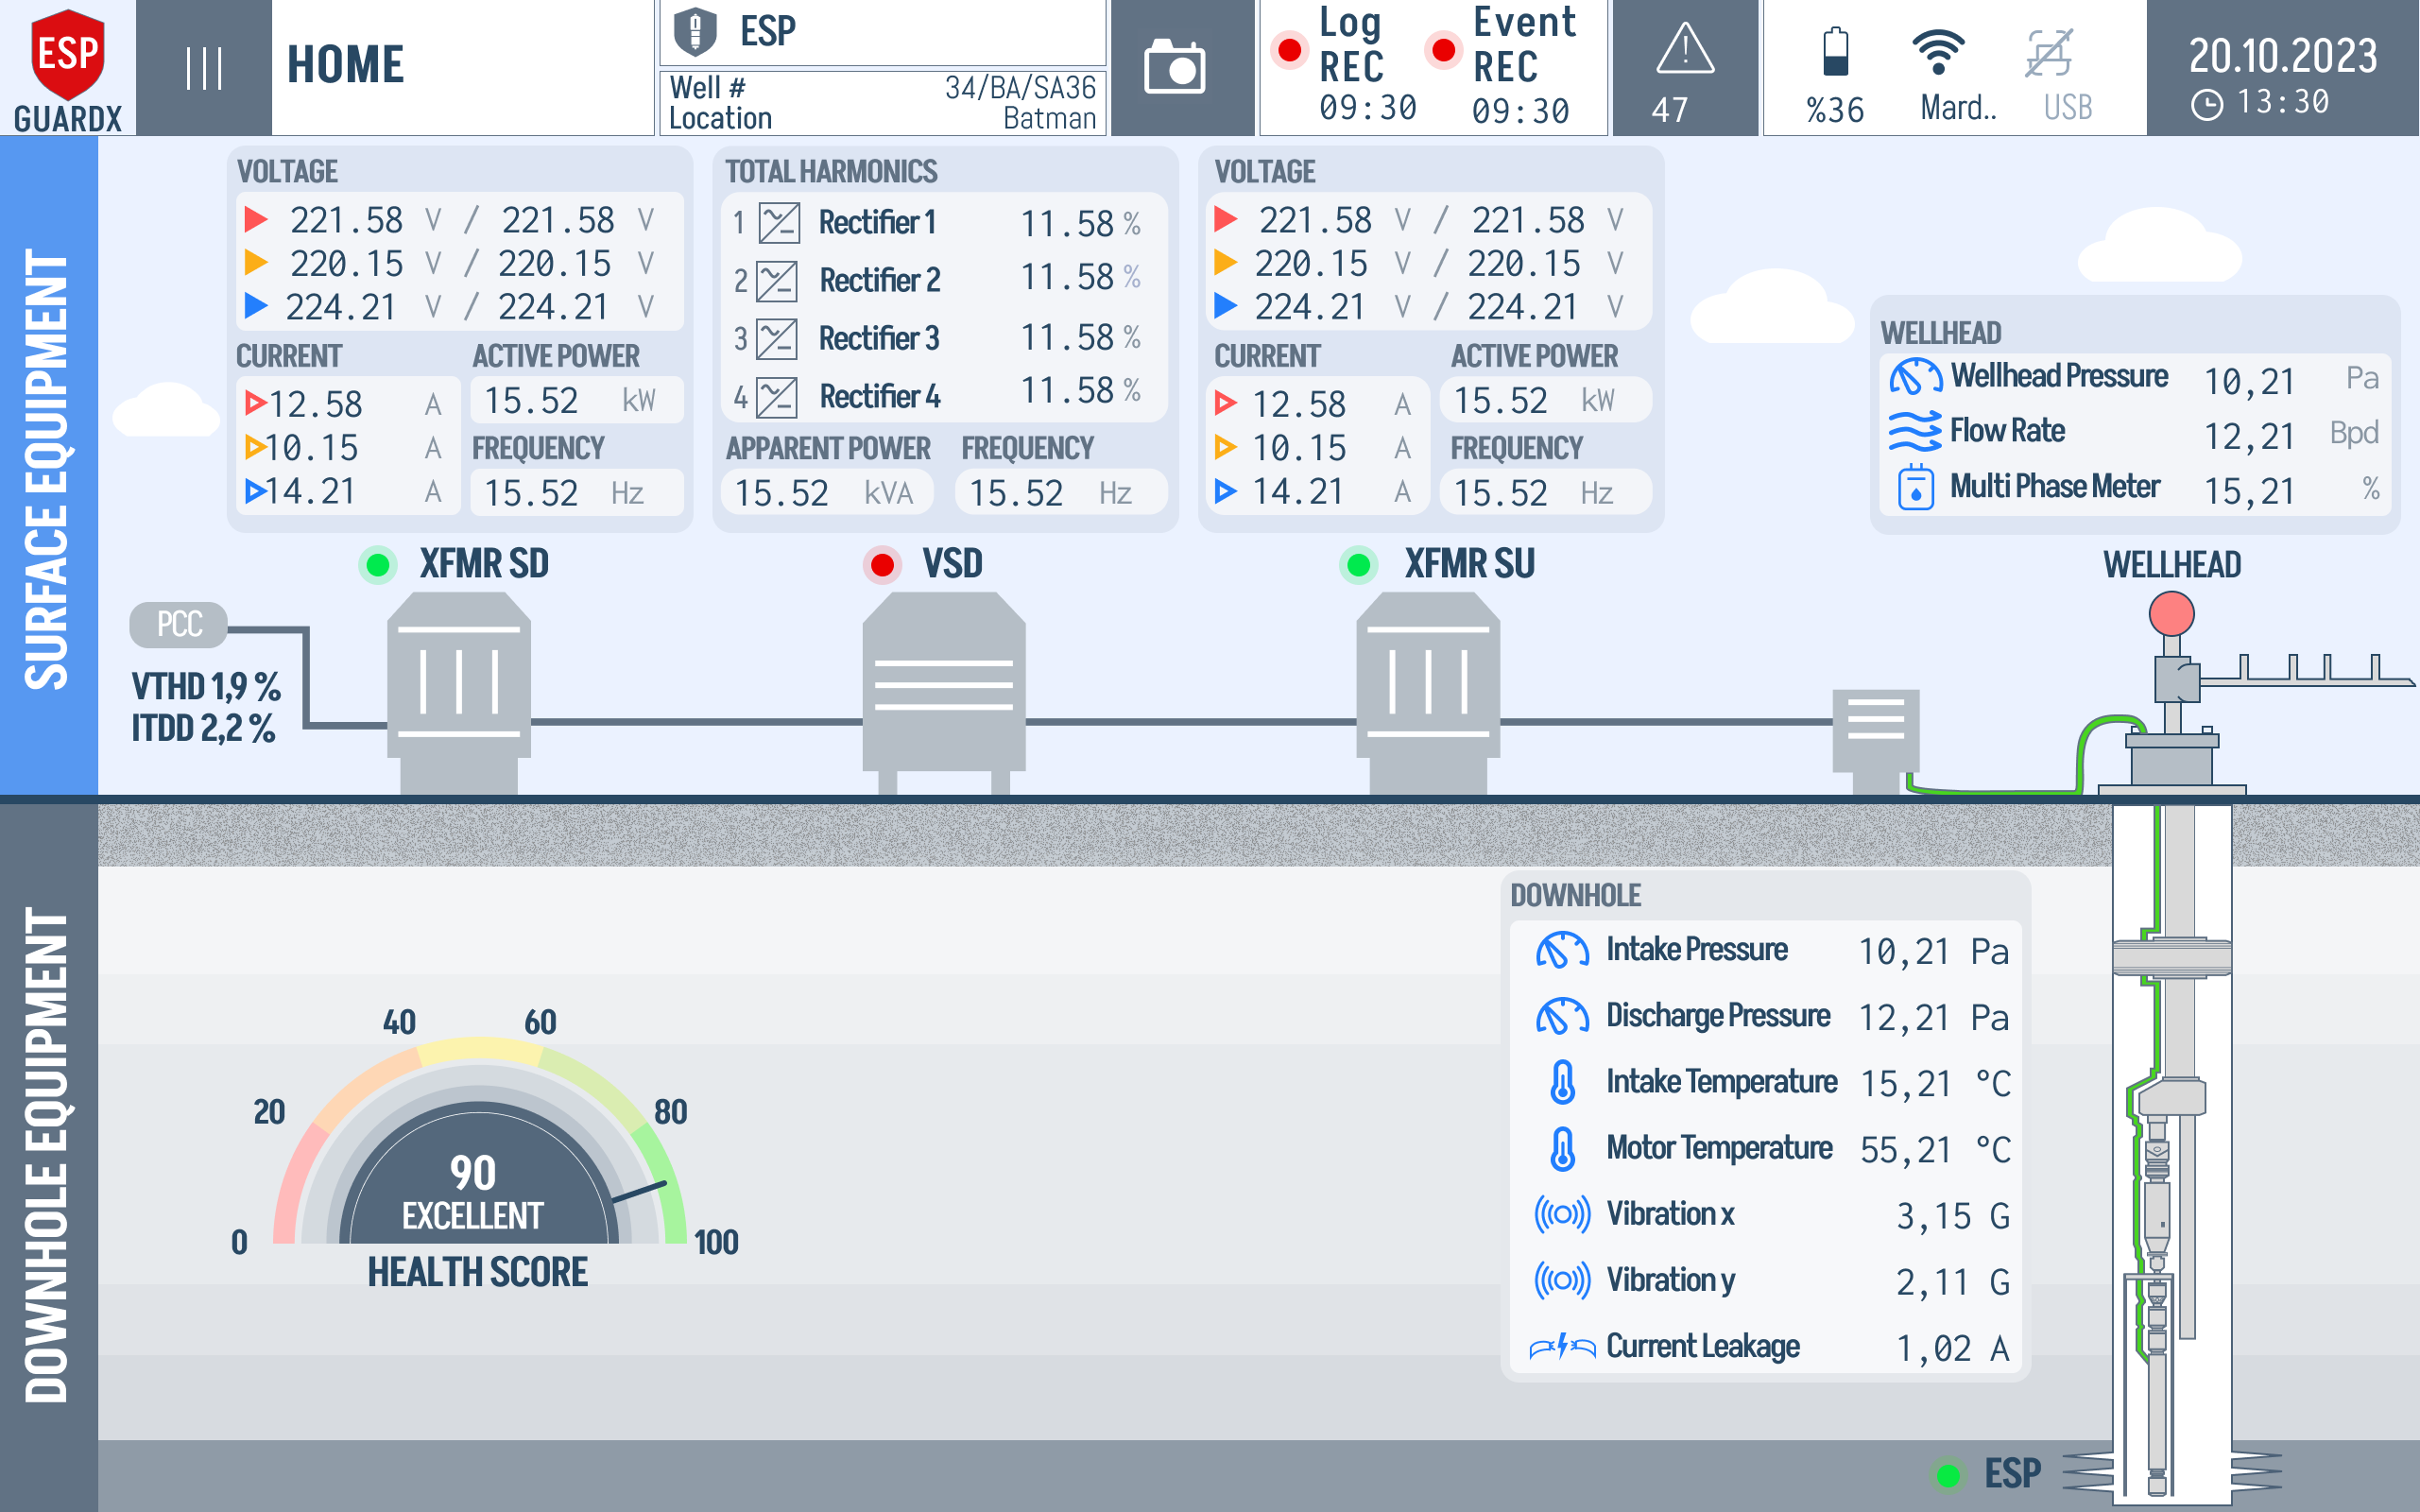
How to Read the Dashboard at a Glance
The screen is split into two horizontal bands — Surface Equipment above ground and Downhole Equipment below ground — connected by an animated cable that visually mirrors the real ESP system.
1. Surface Train Status Dots (top band)
The upper band is a stylised one-line diagram of the surface power train: XFMR SD → VSD → XFMR SU → Wellhead. The small coloured dot above each illustration is the at-a-glance health indicator for that component:
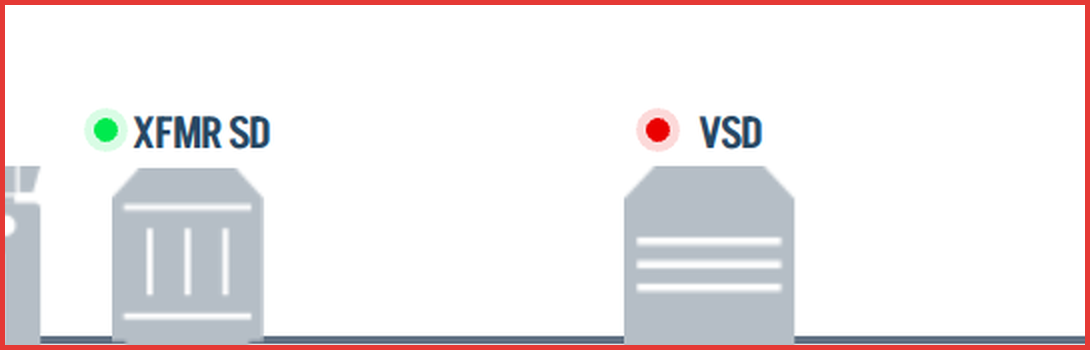
| Dot Colour | What It Means | What to Do |
|---|---|---|
| Green | Every monitored parameter for that component is inside its warn band | Nothing — keep an eye on trends |
| Orange | At least one parameter has crossed its warn threshold | Investigate — check the component's detail page |
| Red | At least one parameter has crossed its trip threshold (event recorded) | Treat as a fault — go to Events to review the recording |
The thresholds that drive the colour are the ones you set in Event Settings, so the dot is only as useful as the limits you've configured.
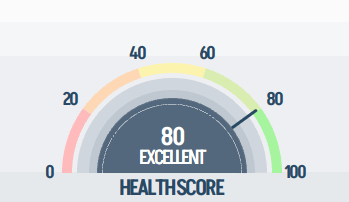
2. System Health Score (downhole band, left)
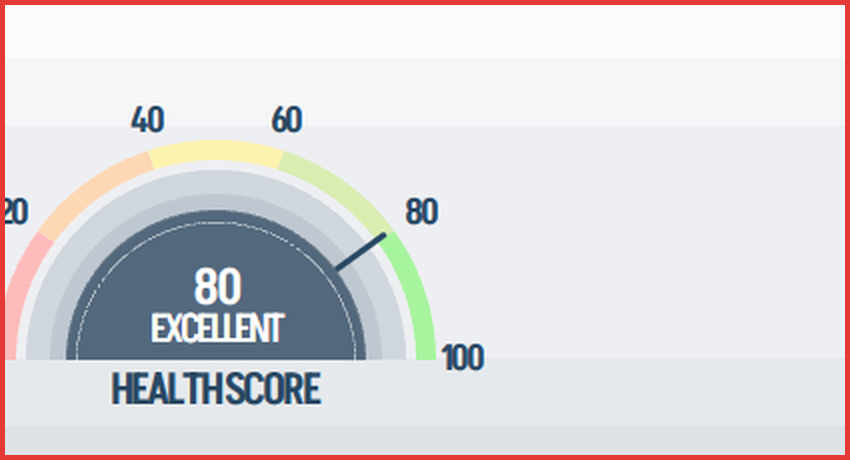
The half-moon gauge fuses motor, pump, power-quality and well readings into a single 0–100 number with a qualitative label (Poor / Fair / Good / Excellent). It weights the same warn / trip distances the dots use, but on a continuous scale — so a score that's been drifting from 95 → 80 over a week is a useful early warning even if no dot has flipped colour yet. The full scoring model and worked 65/100 warning example are documented in Health Score Calculation Logic.
Use it as a trend indicator, not an instantaneous measurement: a single dip is normal noise; a sustained drop calls for an inspection.
3. Downhole ESP Assembly (downhole band, right)
The vertical illustration on the right is the downhole assembly — sensor, motor, seal, intake, pump, discharge — with a green / orange / red ESP dot under it that summarises downhole-side health. Tap any element of the assembly to open its detail screen (Motor, Pump, Well, etc.).
Quick Navigation
Tapping any component on either band drills into its detailed view. You can also use the navigation sidebar on the left to jump directly to Motor, Pump, Well, Status, Waveforms, or Events.
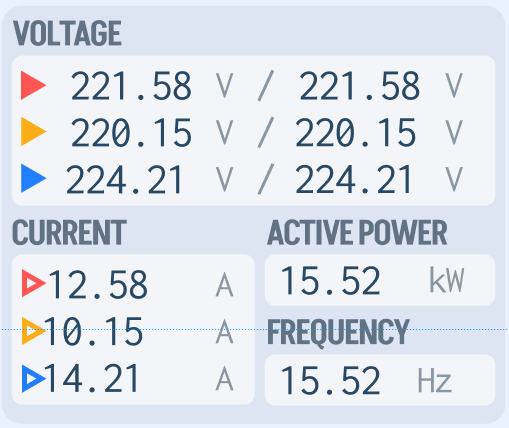
Expanded Live Data Overlay
Tapping the live-data area brings up a floating panel that overlays per-phase electrical readings on top of the equipment diagram. The overlay is split into four component-specific blocks plus a downhole panel — one per equipment item along the surface train.

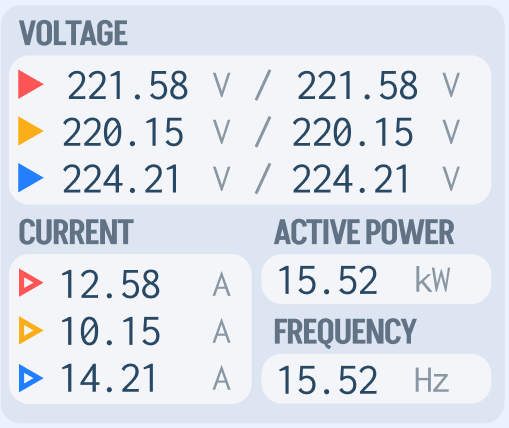
Each block has the same structure: per-phase voltage and current, total harmonics, active power, frequency. The downhole list adds the production-side telemetry.
XFMR SD live data — voltages and currents seen by the step-down transformer.
VSD live data — drive-side voltages, currents and total harmonics.
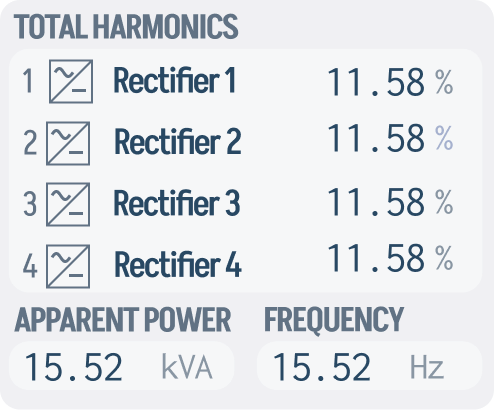
XFMR SU live data — step-up output voltages, currents, apparent power and frequency.
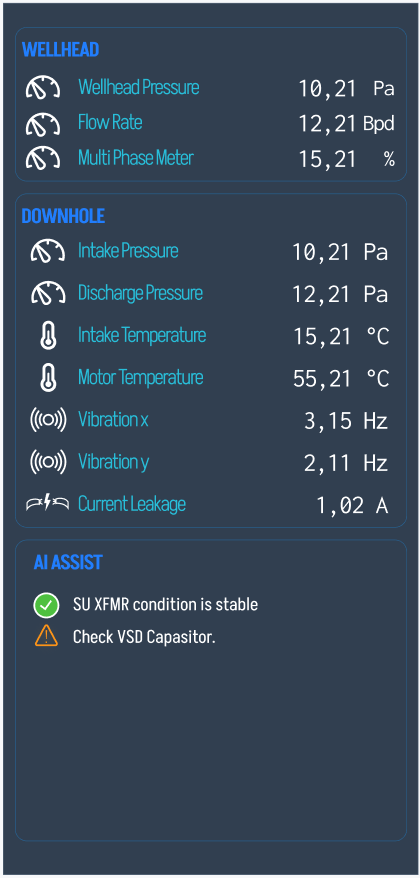
Wellhead live data — the small wellhead panel at the top right.
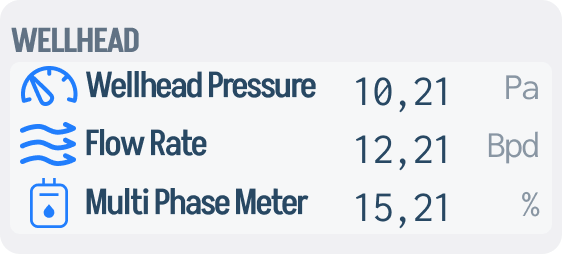
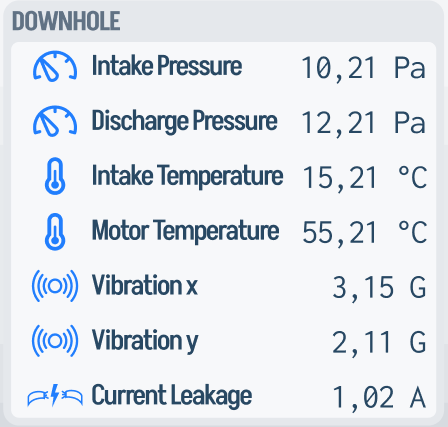
Downhole parameters — Intake Pressure, Discharge Pressure, Intake Temperature, Motor Temperature, Vibration, Current Leakage.
The Health Score gauge is still visible underneath so you can read the score and the underlying numbers at the same time.
The overlay is dismissable — tap outside it to fold the panel back in and return to the clean diagram view.
Quick Settings Panel
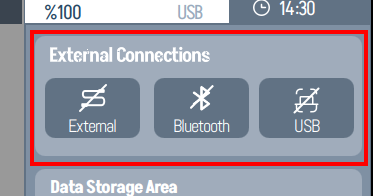
Swipe in from the right (or tap the battery / USB status in the top bar) to open the Quick Settings panel. From here you can toggle external connections, switch storage between SD Card / Internal Memory / USB, adjust volume / brightness / Power Saver, and read out live ambient and device temperatures.
The panel breaks into four blocks from top to bottom:
Connections — toggles for the external comms link and USB.
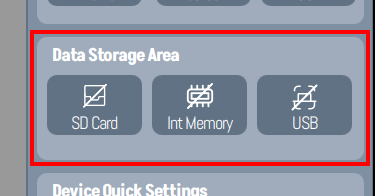
Data Storage — choose where screen captures and event recordings get written: SD Card, Internal Memory, or USB.
Audio / Display / Power — system volume, screen brightness, and Power Saver mode.
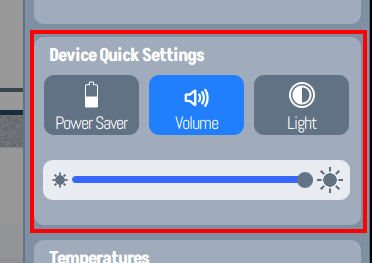
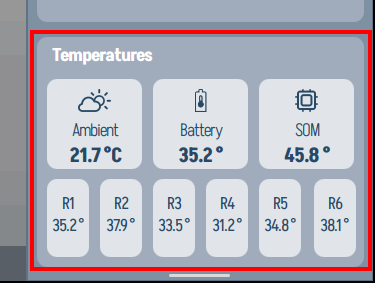
Live Temperatures — Ambient, Battery, and SOM temperatures, refreshed in real time.
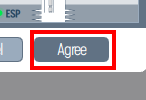
Capturing Screenshots
Tap the camera icon in the top bar to capture the current screen. A confirmation dialog appears with a preview; tap Agree to save it (or Cancel to discard). Saved screenshots land in the configured Data Storage area (SD Card / Internal Memory / USB).
The camera icon itself sits in the top toolbar:
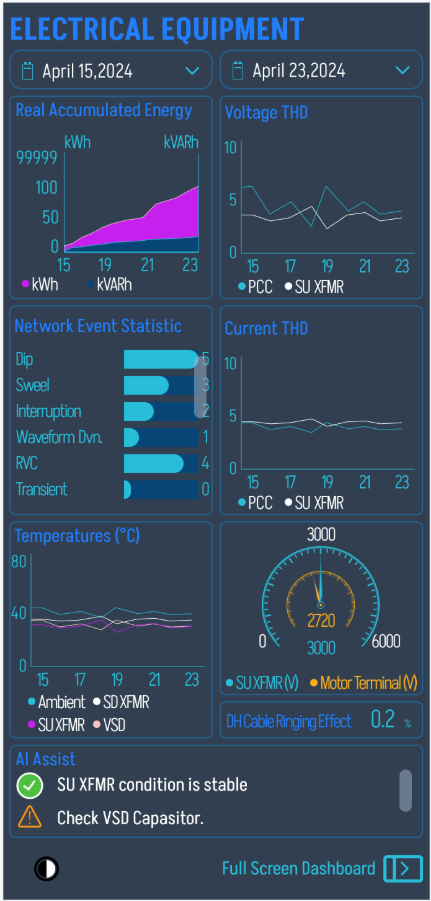
Electrical Equipment View
The Electrical Equipment dashboard is a dedicated analytics view focused on the surface power train. It has six analytic panels arranged in a 3×2 grid plus a footer of measured voltages.
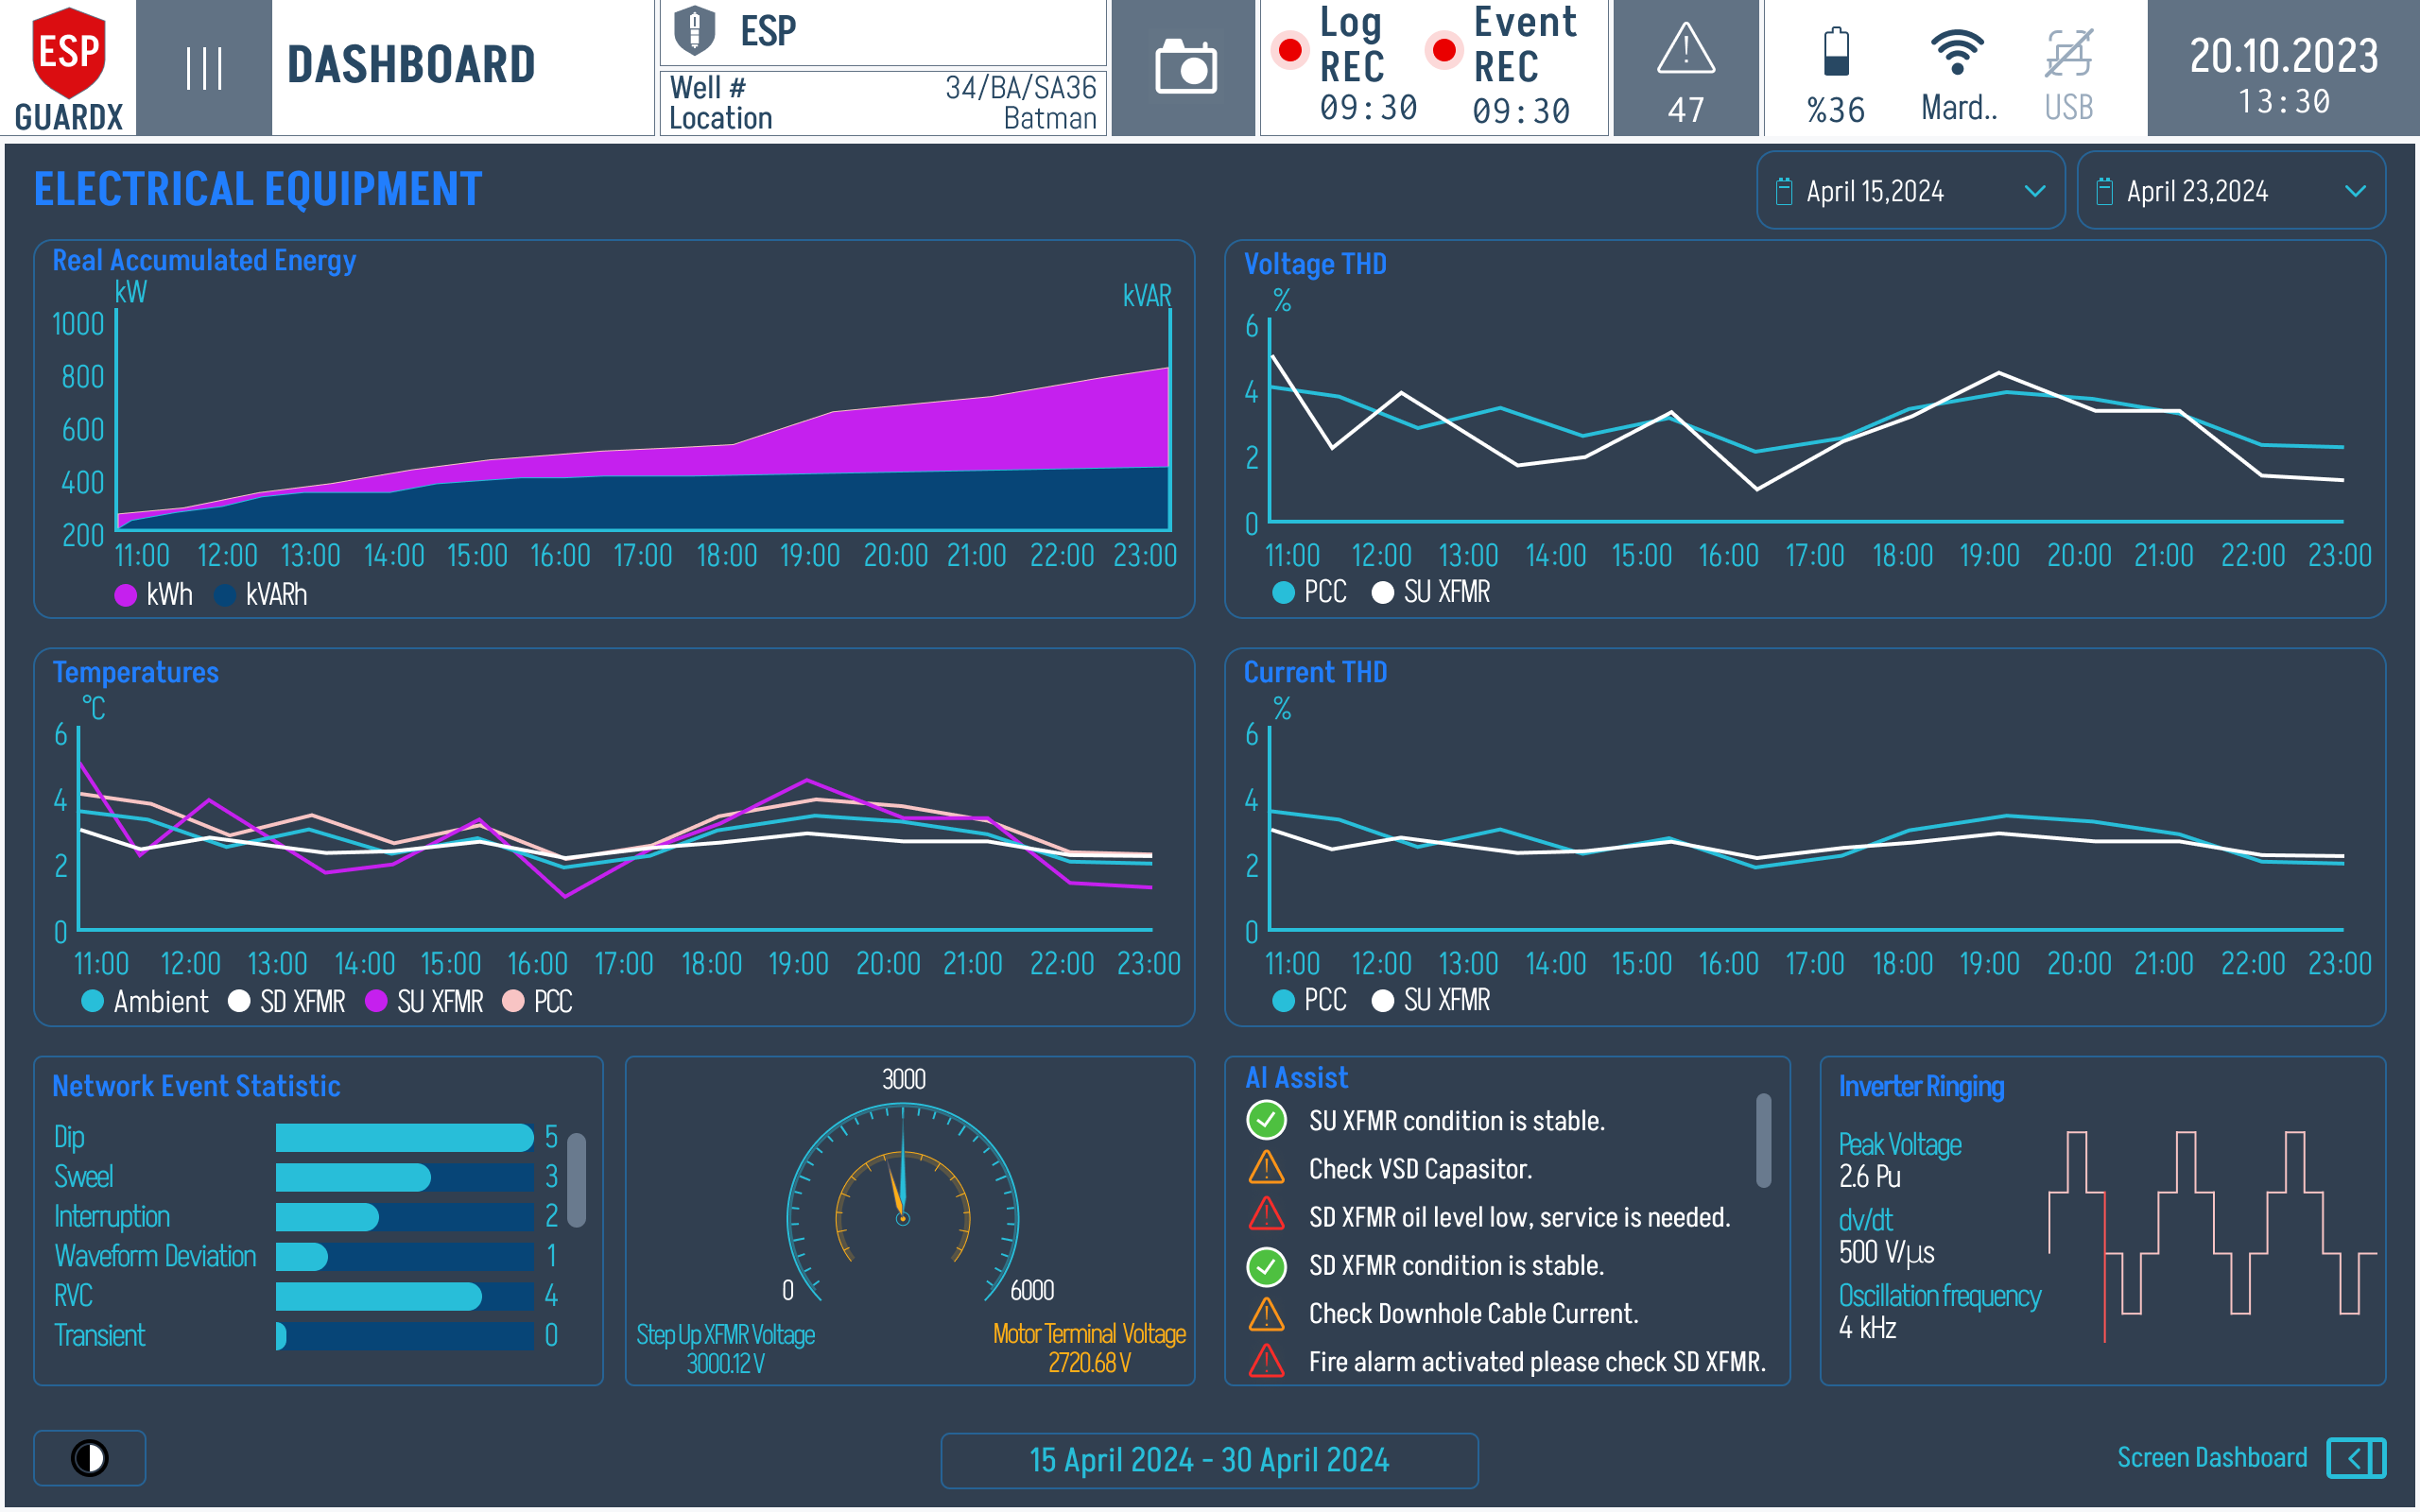
This populated view is useful because the chart shapes are visible: accumulated energy climbs through the shift, voltage/current THD can be compared across the PCC and transformers, and the AI Assist list sits beside inverter ringing so the operator can connect a waveform symptom to a recommended inspection.
Reading left-to-right, top-to-bottom:
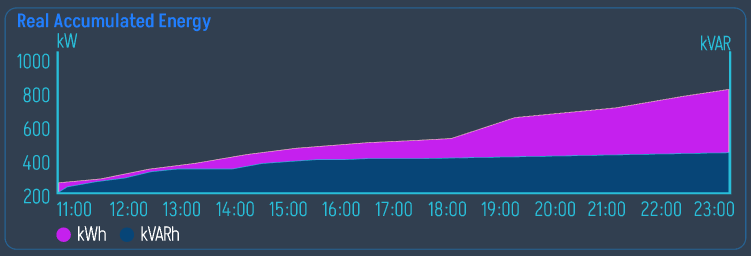
Real Accumulated Energy (top left) — running totals of imported and exported energy across PCC / SD XFMR / SU XFMR.
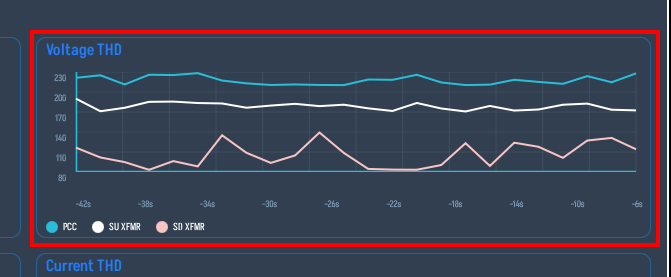
Voltage THD (top right) — total harmonic distortion of the voltage waveform measured at PCC, SD XFMR and SU XFMR; same three traces overlaid on a time chart.
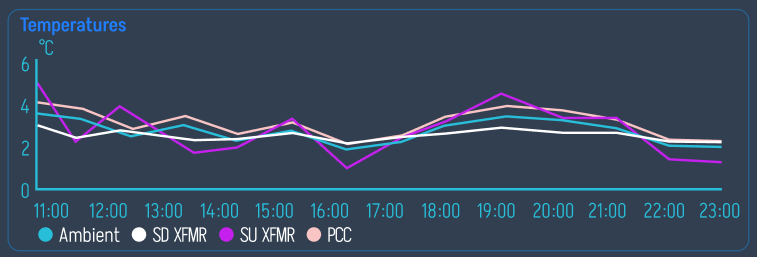
Temperatures (middle left) — temperature trends for the surface equipment.
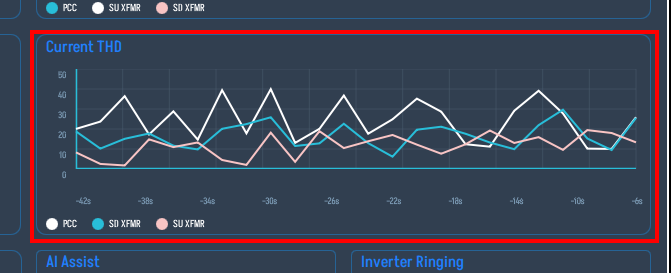
Current THD (middle right) — same as Voltage THD but for current.
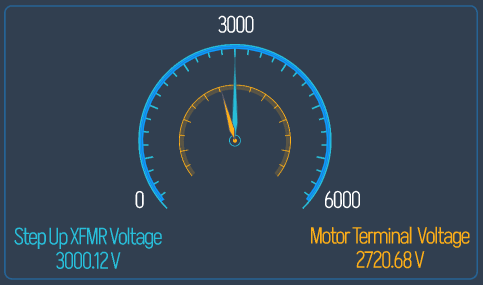
Step Up XFMR Voltage / Motor Terminal Voltage (bottom centre) — the two key voltages between which the SU XFMR ratio is computed.
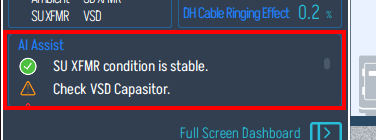
AI Assist (bottom centre-right) — running condition calls per component (SU XFMR / VSD Capacitor / SD XFMR oil level / Downhole Cable Current). Each row carries a tick (OK), warning, or alarm icon.
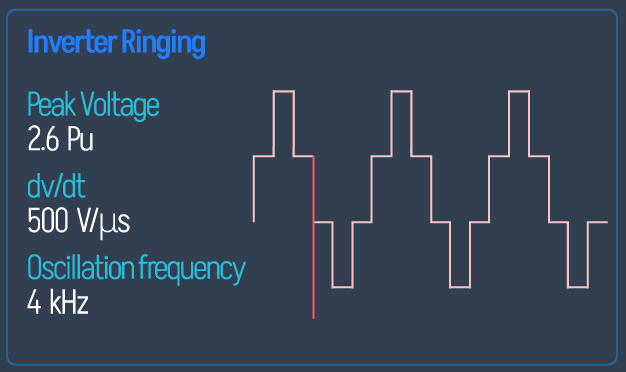
Inverter Ringing (bottom right) — Peak Voltage, dv/dt, and Oscillation Frequency of the VSD inverter switching transients.
A Network Event Statistic bar chart (Dip / Swell / Interruption / Waveform / Deviation / RVC / Transient counts) sits under Temperatures.
Compact Layout
Pressing Screen Dashboard at the bottom-right of the screen toggles into a compact layout that keeps the surface-equipment animation in the centre and stacks every analytic panel into two narrow columns on the left and right.
The left column carries the analytic charts (Real Accumulated Energy, Network Event Statistic, AI Assist, Inverter Ringing). The right column carries the live electrical readings — per-phase voltages, currents, harmonics, and apparent / reactive / active power — broken down per component (PCC / VSD / Wellhead).
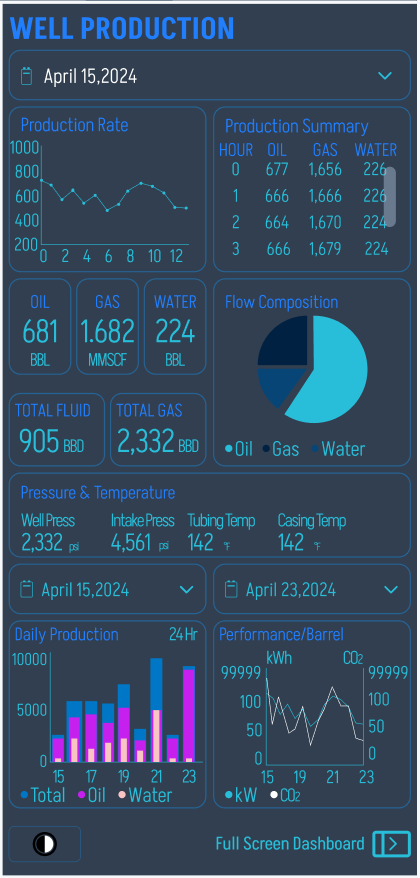
Well Production View
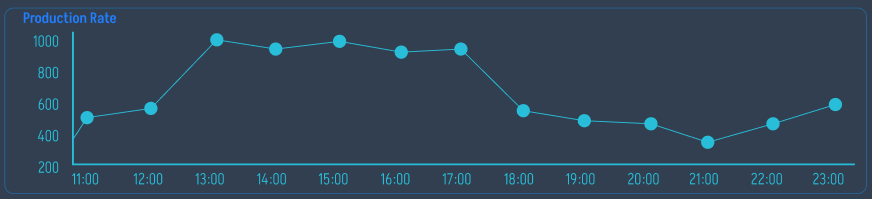
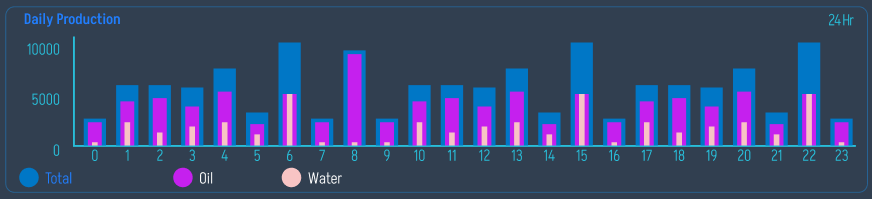
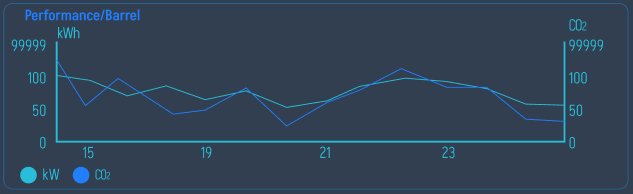
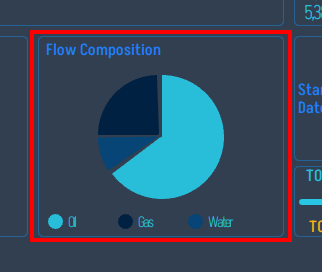
The Well Production dashboard aggregates production-side data: hourly production summary (Oil BPD, Gas MMSCF, Water BBL), daily totals, flow composition pie chart, wellhead and downhole pressures and temperatures, vibration, current leakage, startup-date calendar, and running-hours / stand-by gauges since last start / shutdown.
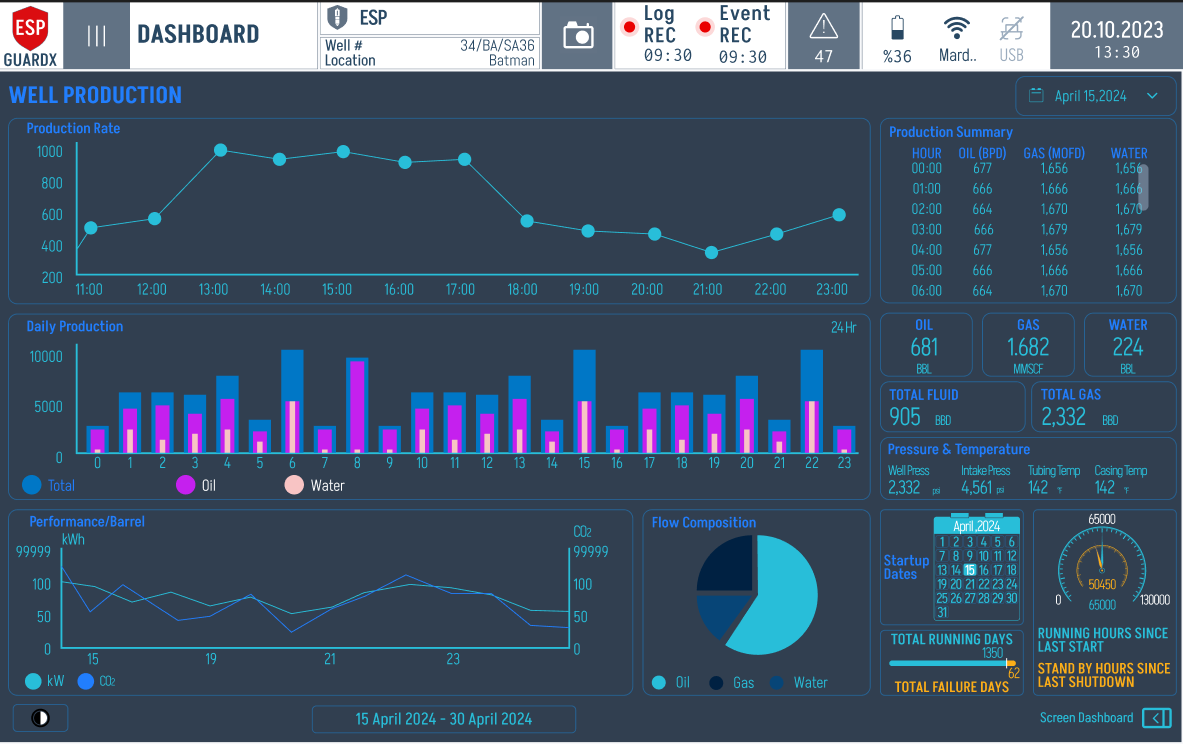
The left half of the page is occupied by the Hourly Production Summary charts (top), the Daily Totals bar (middle) and the Flow Composition pie chart with running totals (bottom). The right half carries pressure / temperature trends, vibration, and the running-hours gauges.
Production totals are calculated from the approved parameter model: Qflow is integrated over running time to calculate Vfluid, then oil, water, and gas totals are calculated from fo, fw, and fg. See Production and Well Parameters for the source variables and formulas.
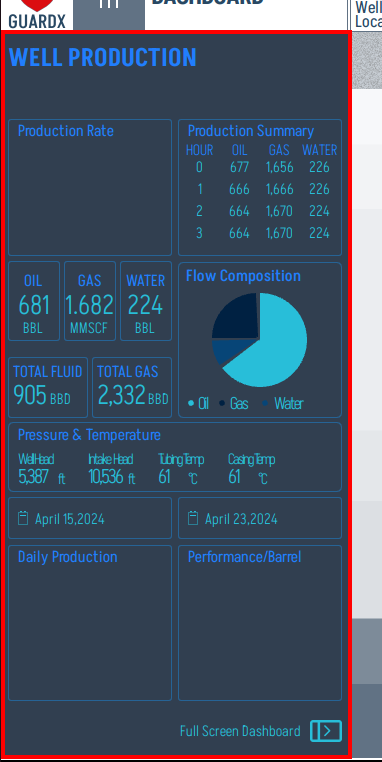
Compact Layout
The Well Production page also has a compact layout that keeps the surface-equipment animation in the centre with summary chips on the left and right. Use it when you want to glance at production state without leaving the equipment overview.
The left column carries the production summary chips (Oil / Gas / Water totals, Flow Composition snapshot, running hours).
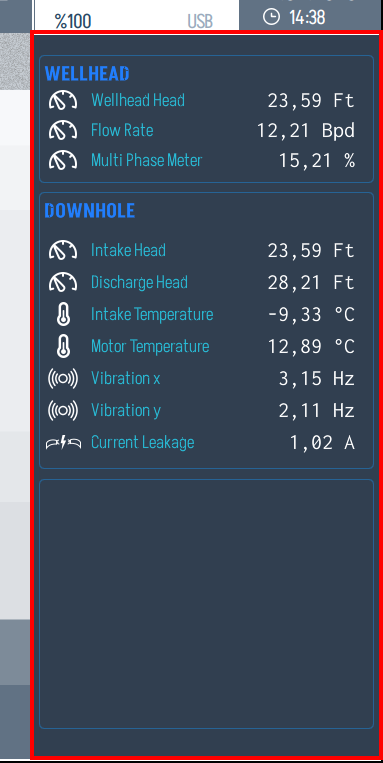
In the populated compact view, the small production-rate, daily-production, and performance-per-barrel charts are visible beside the wellbore diagram. Use this layout when you want production trends and downhole live values on the same screen.
The right column carries downhole and wellhead live values (pressures, temperatures, vibration, current leakage).
Real-Time Updates
The Dashboard refreshes at 5–10 Hz (every 100–200 ms), providing near-instantaneous updates of all monitored parameters. Data flows directly from the SPI data acquisition hardware through the processing layer to the display.
Skeleton Loading
When the Dashboard is loading for the first time after startup, a skeleton loading animation is displayed instead of a blank screen. This provides visual feedback that the system is initializing.