Motor Monitoring
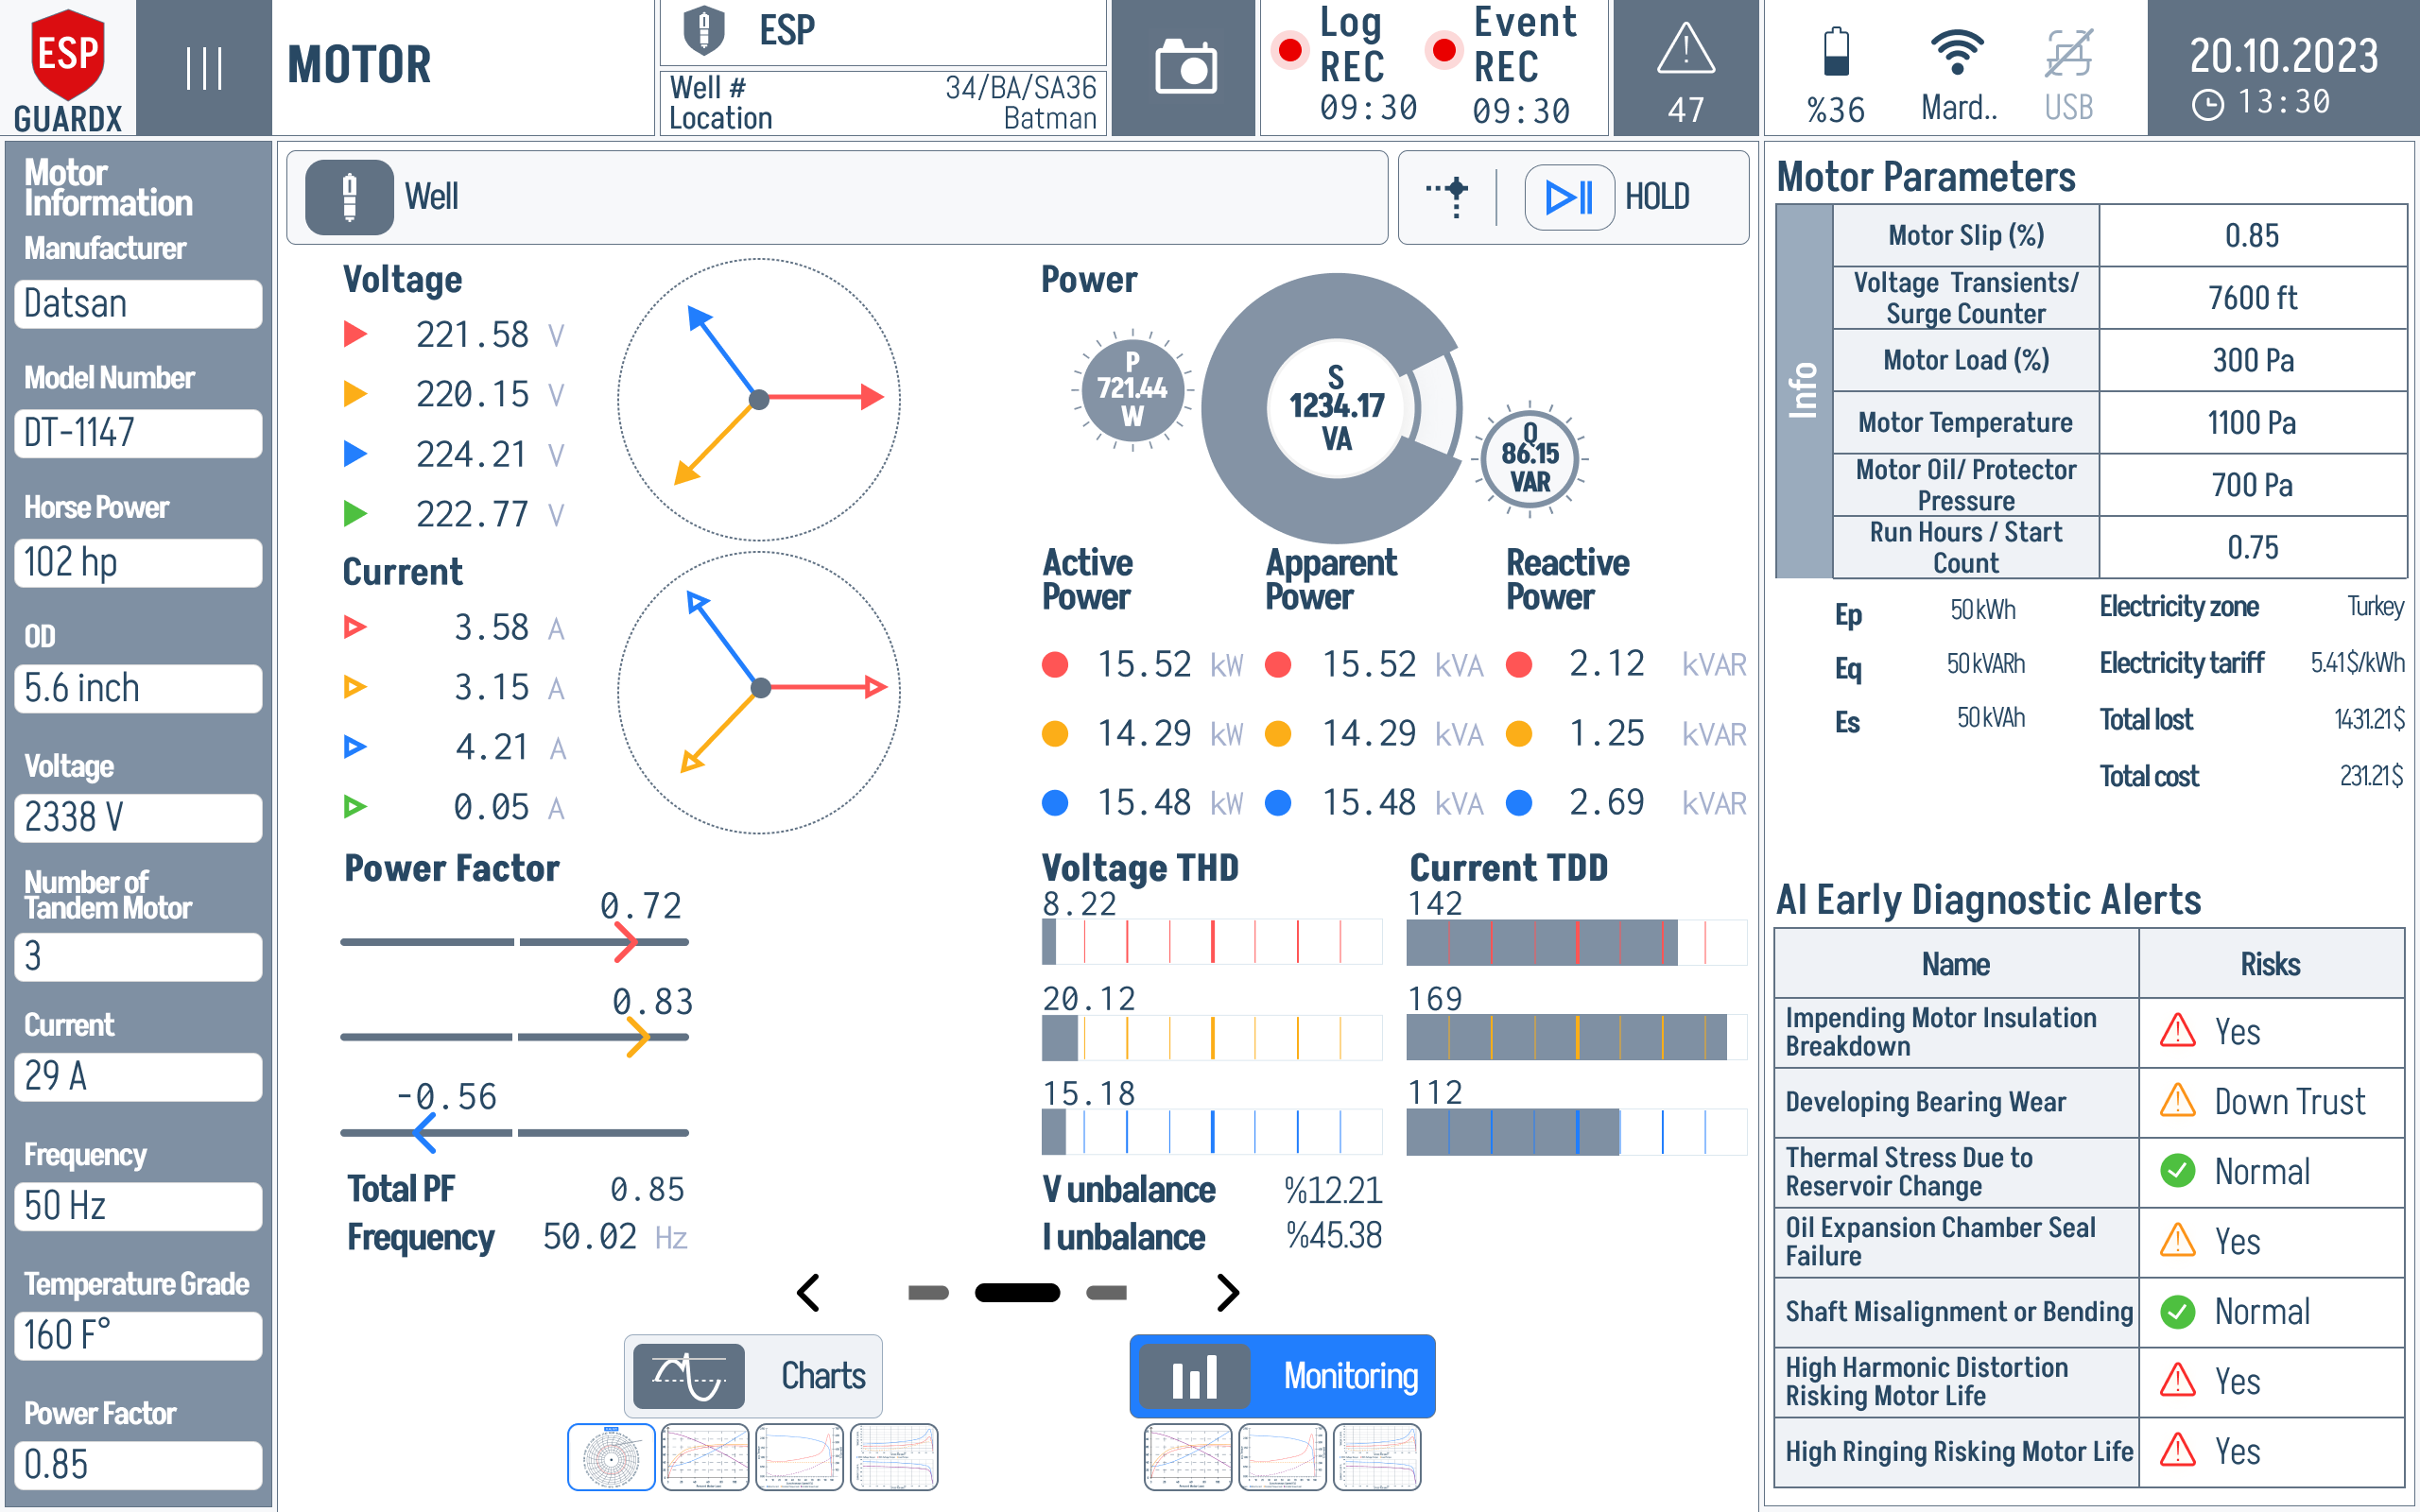
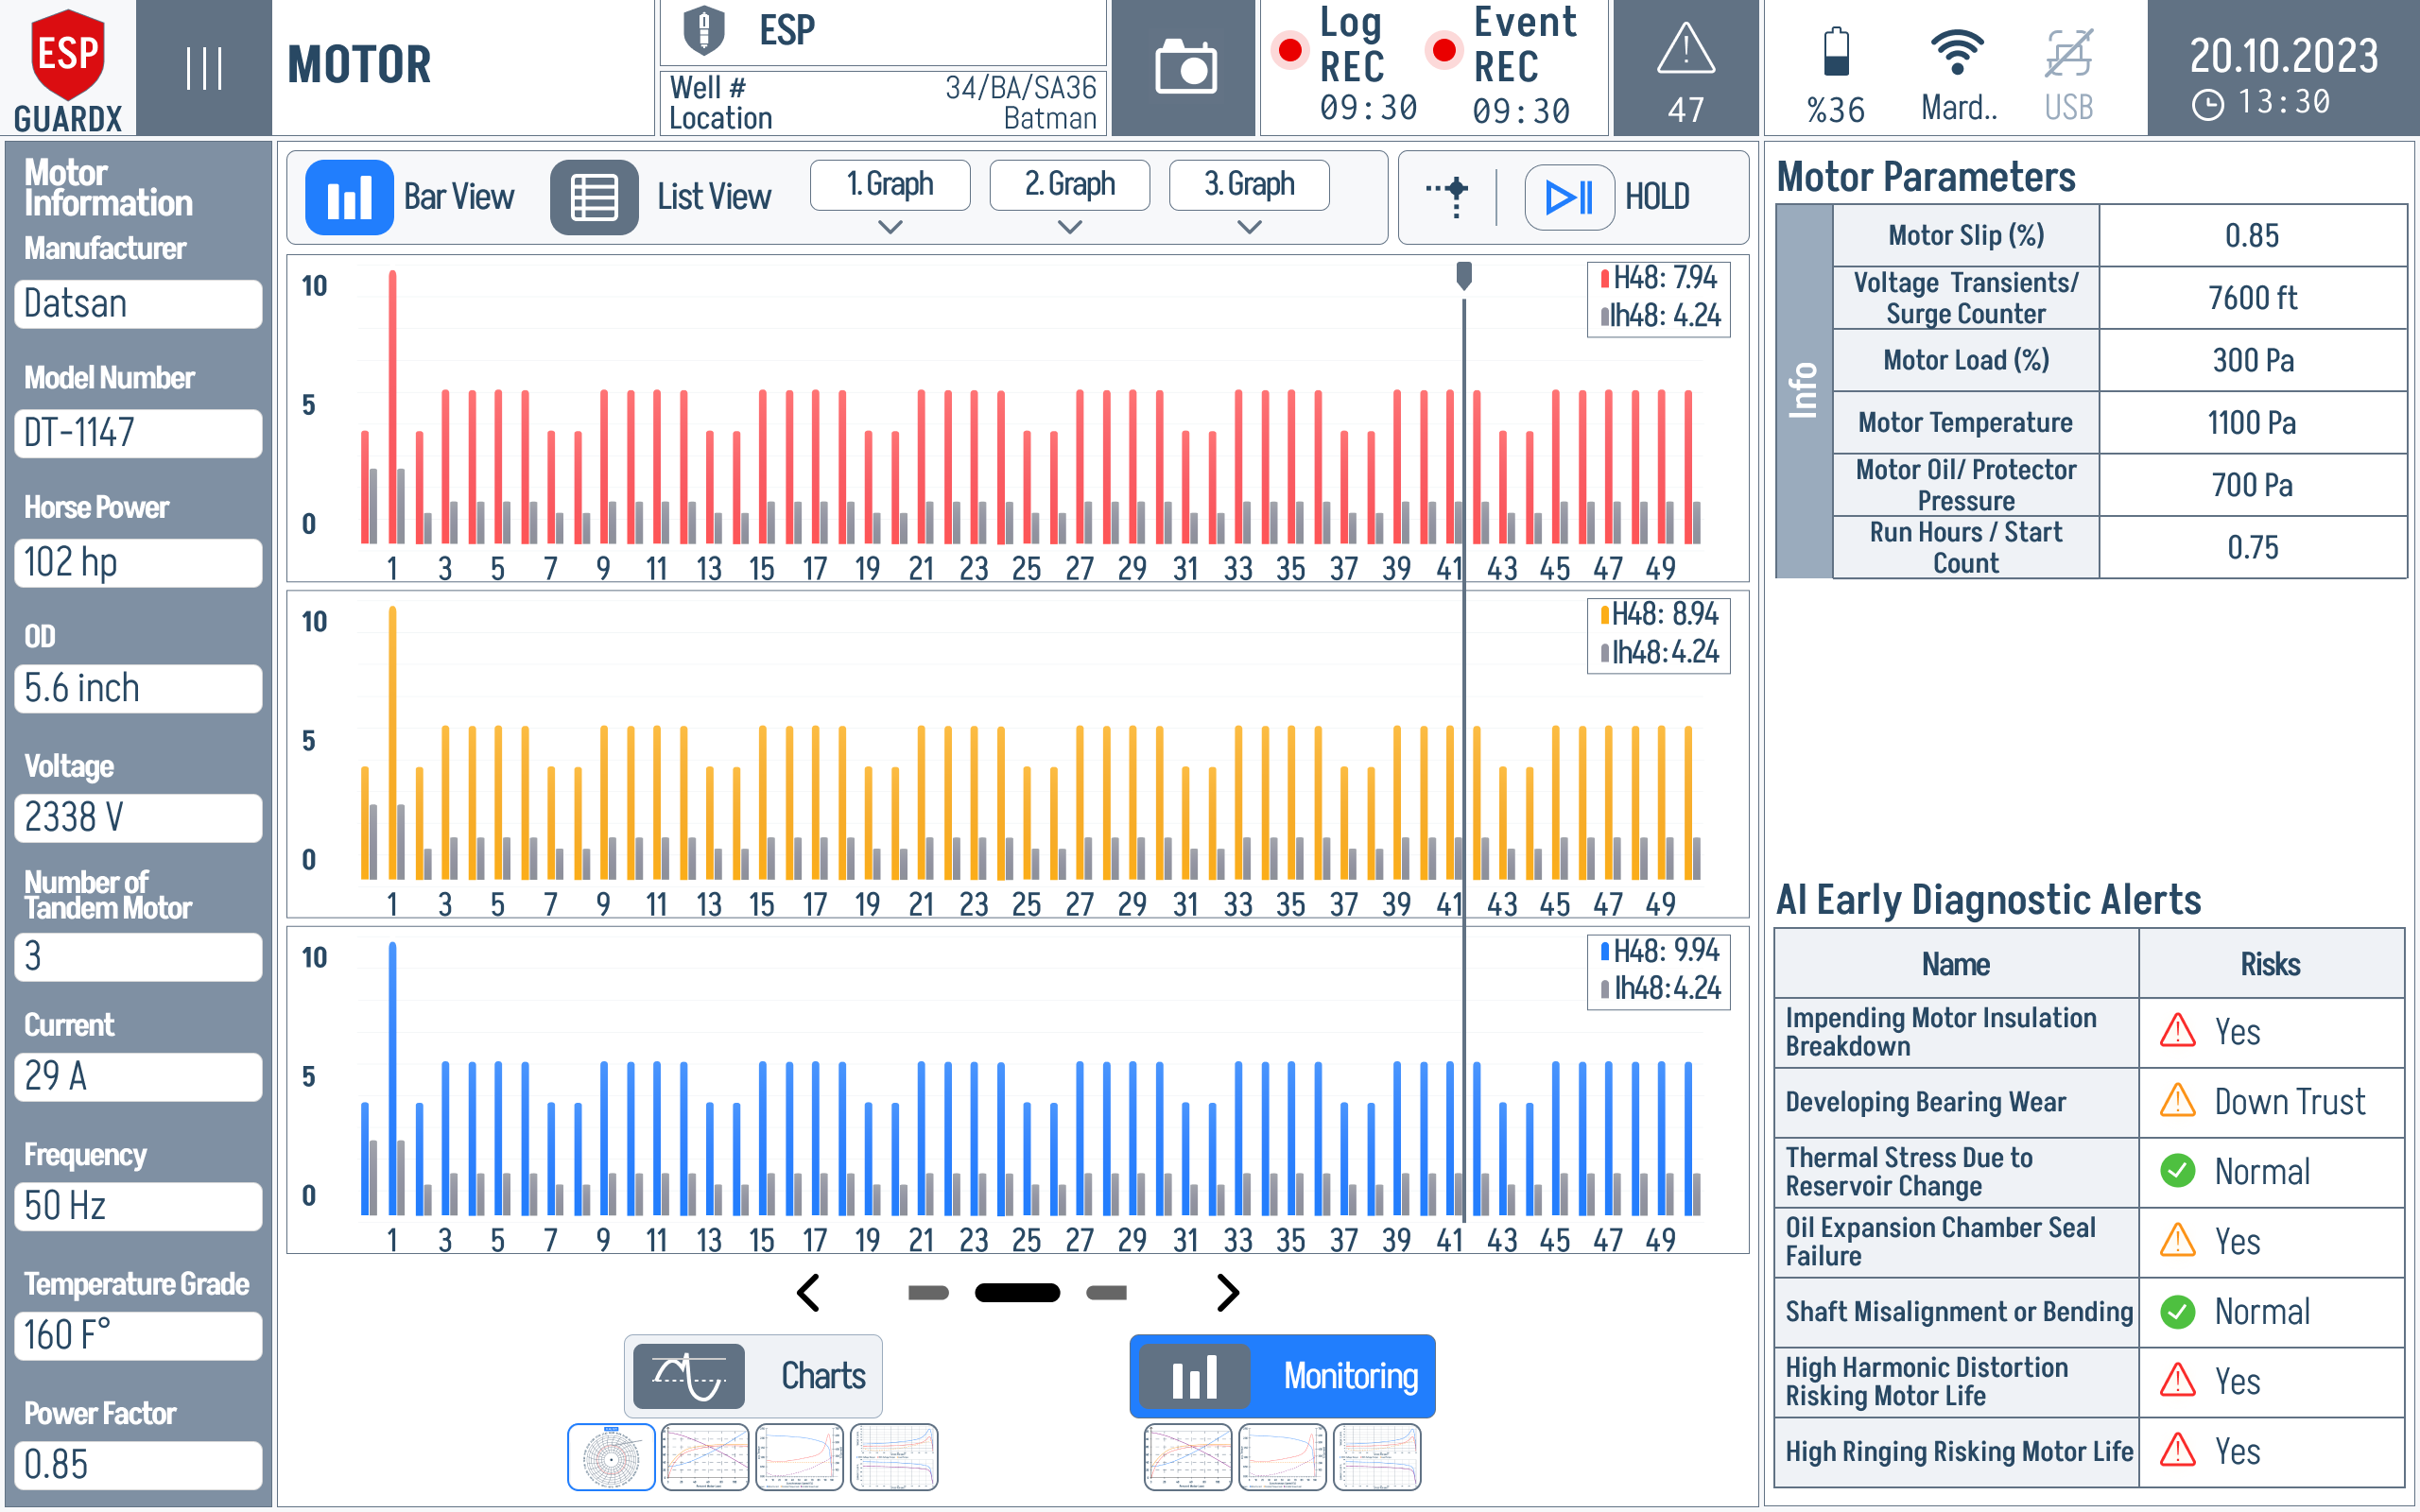
The Motor screen is the diagnostic deep-dive on the ESP motor. The Monitoring tab (shown below) gives you live electrical readings, the motor's power gauges, its nameplate parameters, and an AI-driven early-warning panel — all on one screen. Access it from the Motor tab in the navigation sidebar.
Reading the Monitoring Tab
The Monitoring tab is laid out so the eye sweeps left-to-right: raw per-phase readings on the left, derived power in the middle, motor specs on the upper right, and AI risk calls on the lower right.
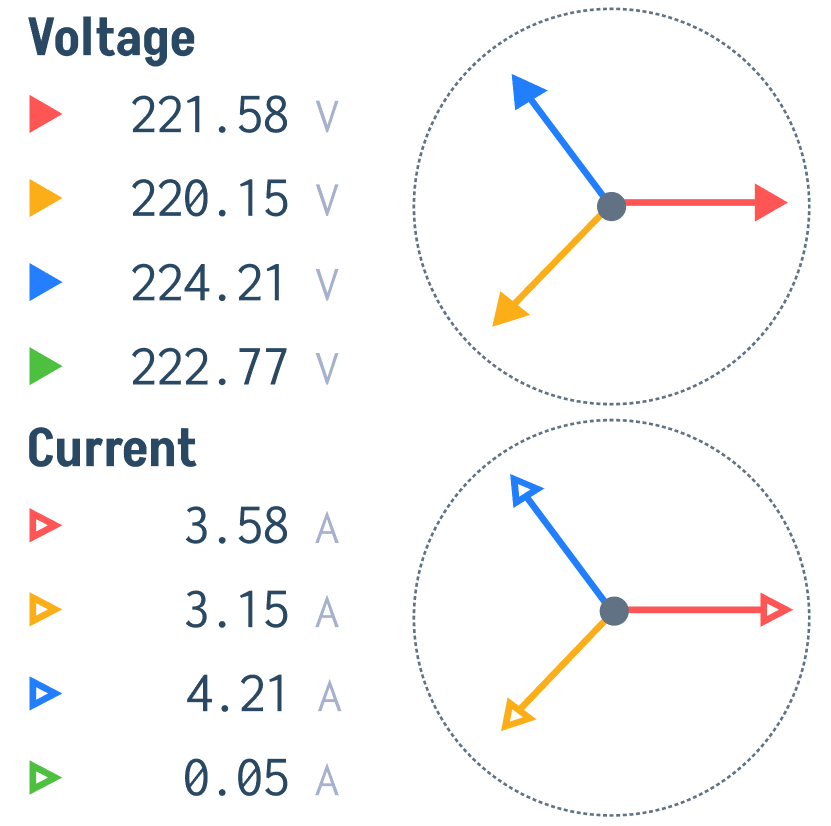
Voltages and Currents (left column) — V Phase A / B / C and I Phase A / B / C, each with a small phasor diagram showing the phase angles. Healthy 3-phase = three vectors 120° apart and equal length.
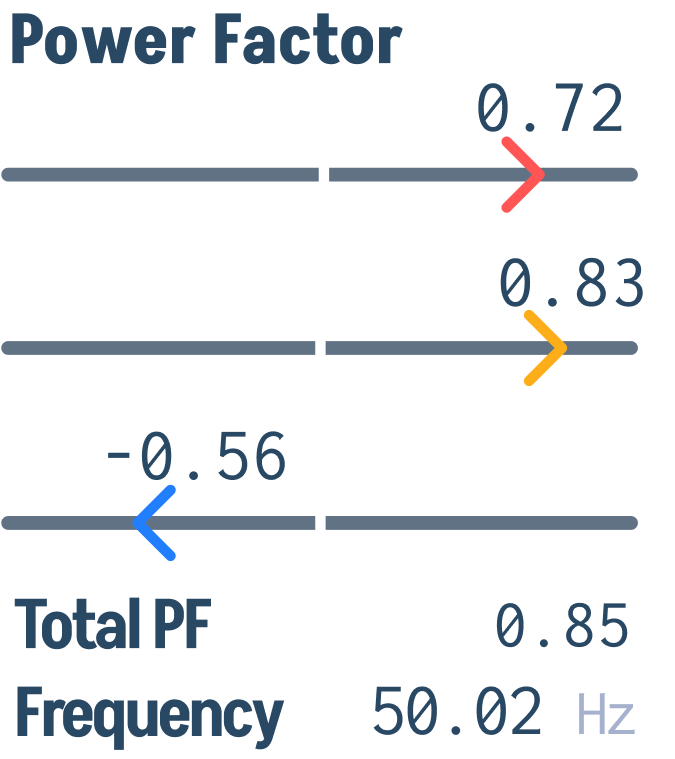
Power Factor / Frequency / Total PF (lower-left) — the secondary readings derived from the per-phase data: total power factor, supply frequency, and the per-phase PF row.
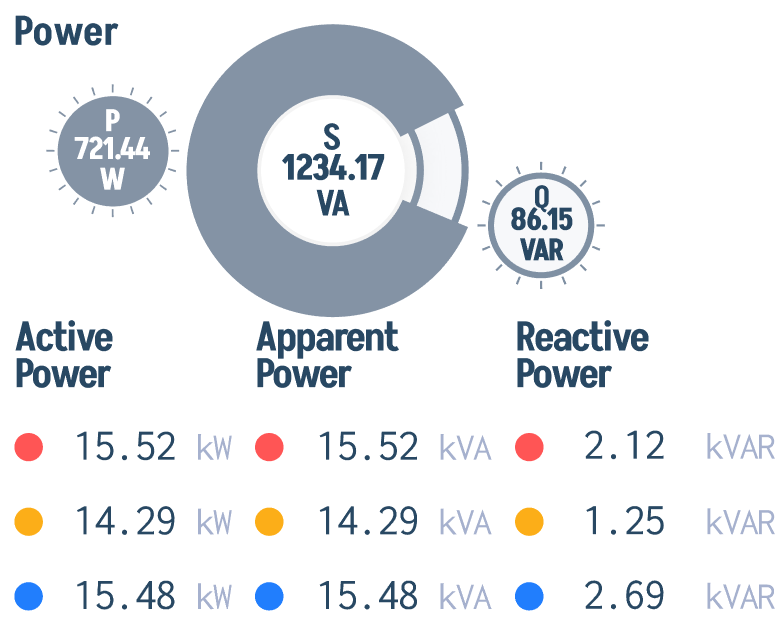
Power gauges (centre, top) — three concentric gauges: P (active, kW), S (apparent, kVA), Q (reactive, kVAR). Below them sit the per-phase Active / Apparent / Reactive power readings.
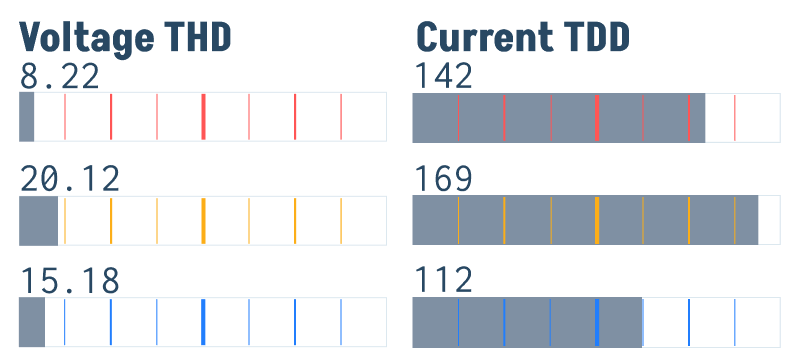
Voltage THD / Current TDD (lower-centre) — total harmonic distortion stripes per phase. A non-zero stripe under any phase means harmonics are present on that line.
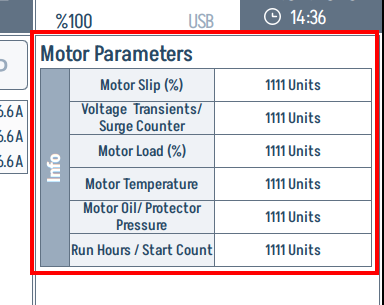
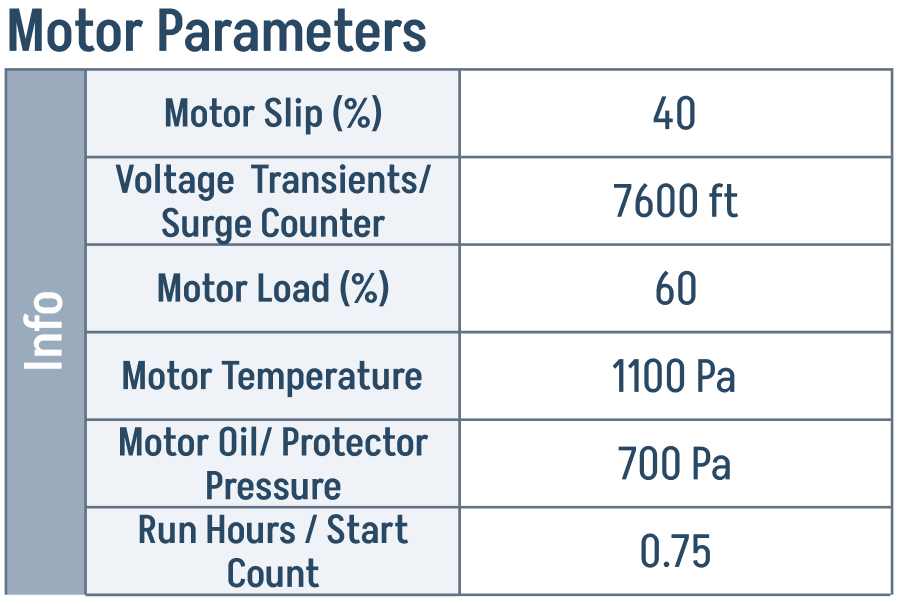
Motor Parameters table (top right) — live values for Motor Slip (%), Voltage Transients / Surge Counter, Motor Load (%), Motor Temperature, Motor Oil / Protector Pressure, and Run Hours / Start Count. This is the nameplate-vs-reality view.
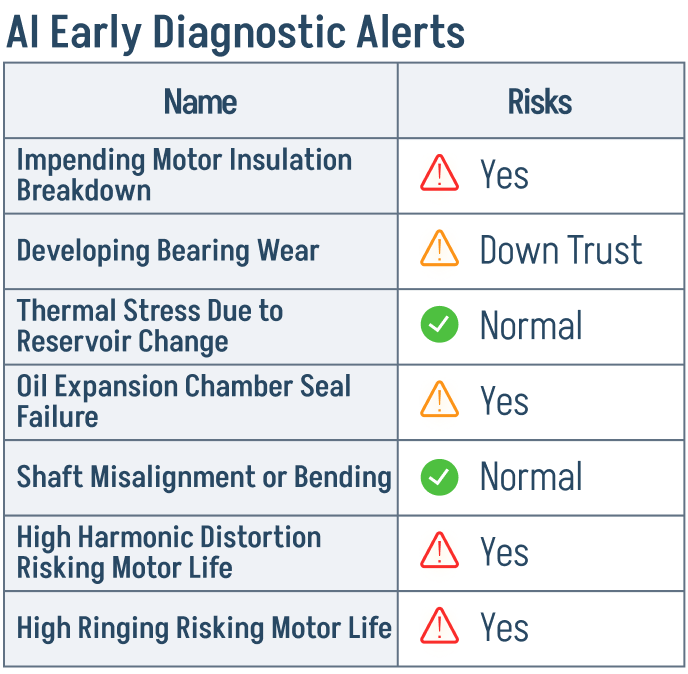
AI Early Diagnostic Alerts (lower right) — a live risk list — Insulation Breakdown, Bearing Wear, Thermal Stress, Oil Expansion Chamber Seal Failure, Shaft Misalignment, High Harmonic Distortion, High Ringing — each with a green / orange / red status.
What the AI Alerts Actually Watch
The alerts panel deserves close attention because it is the primary "should I send a technician out?" signal on the Monitoring tab.

A green check means the input parameters for that fault mode are inside their normal envelope. An orange triangle means a precursor pattern is being seen (rising trend, partial unbalance) — investigate but do not stop the well. A red triangle means the fault signature is matched and a real maintenance action is recommended.
Power Gauges in Detail
The P / S / Q trio captures the entire AC-power story in one block:
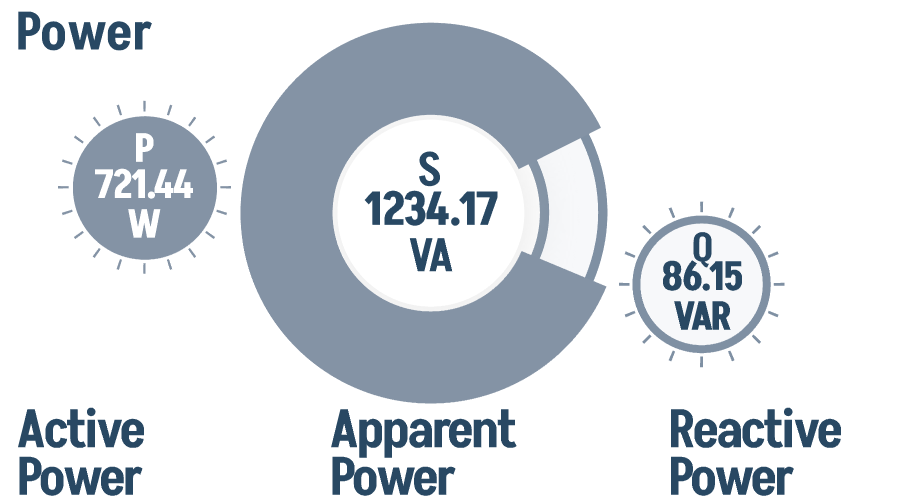
- P (Active Power, kW) — useful work the motor is converting into shaft horsepower.
- S (Apparent Power, kVA) — total power drawn from the supply (vector sum of P and Q).
- Q (Reactive Power, kVAR) — magnetising power that bounces between the supply and the motor's windings without doing real work.
Reading them as a triangle: if Q is creeping up while P stays flat, your Power Factor is degrading and the supply is being loaded more than the actual mechanical work justifies — usually a sign of light loading or a worsening insulation/winding issue.
Motor Load Gauge
The Motor Load (%) row in the Motor Parameters table is the single most diagnostic number on the screen. It is computed as the ratio of actual current draw to the motor's rated current.
| Load Range | Indication |
|---|---|
| 0–50% | Light load |
| 50–80% | Normal operating range |
| 80–100% | Heavy load |
| >100% | Overload condition |
Motor Performance Curves
Switch from Monitoring to the Charts tab and the centre panel becomes a four-curve overlay — every curve plotted against % motor load on a shared x-axis, with the live operating point pinned on each one.
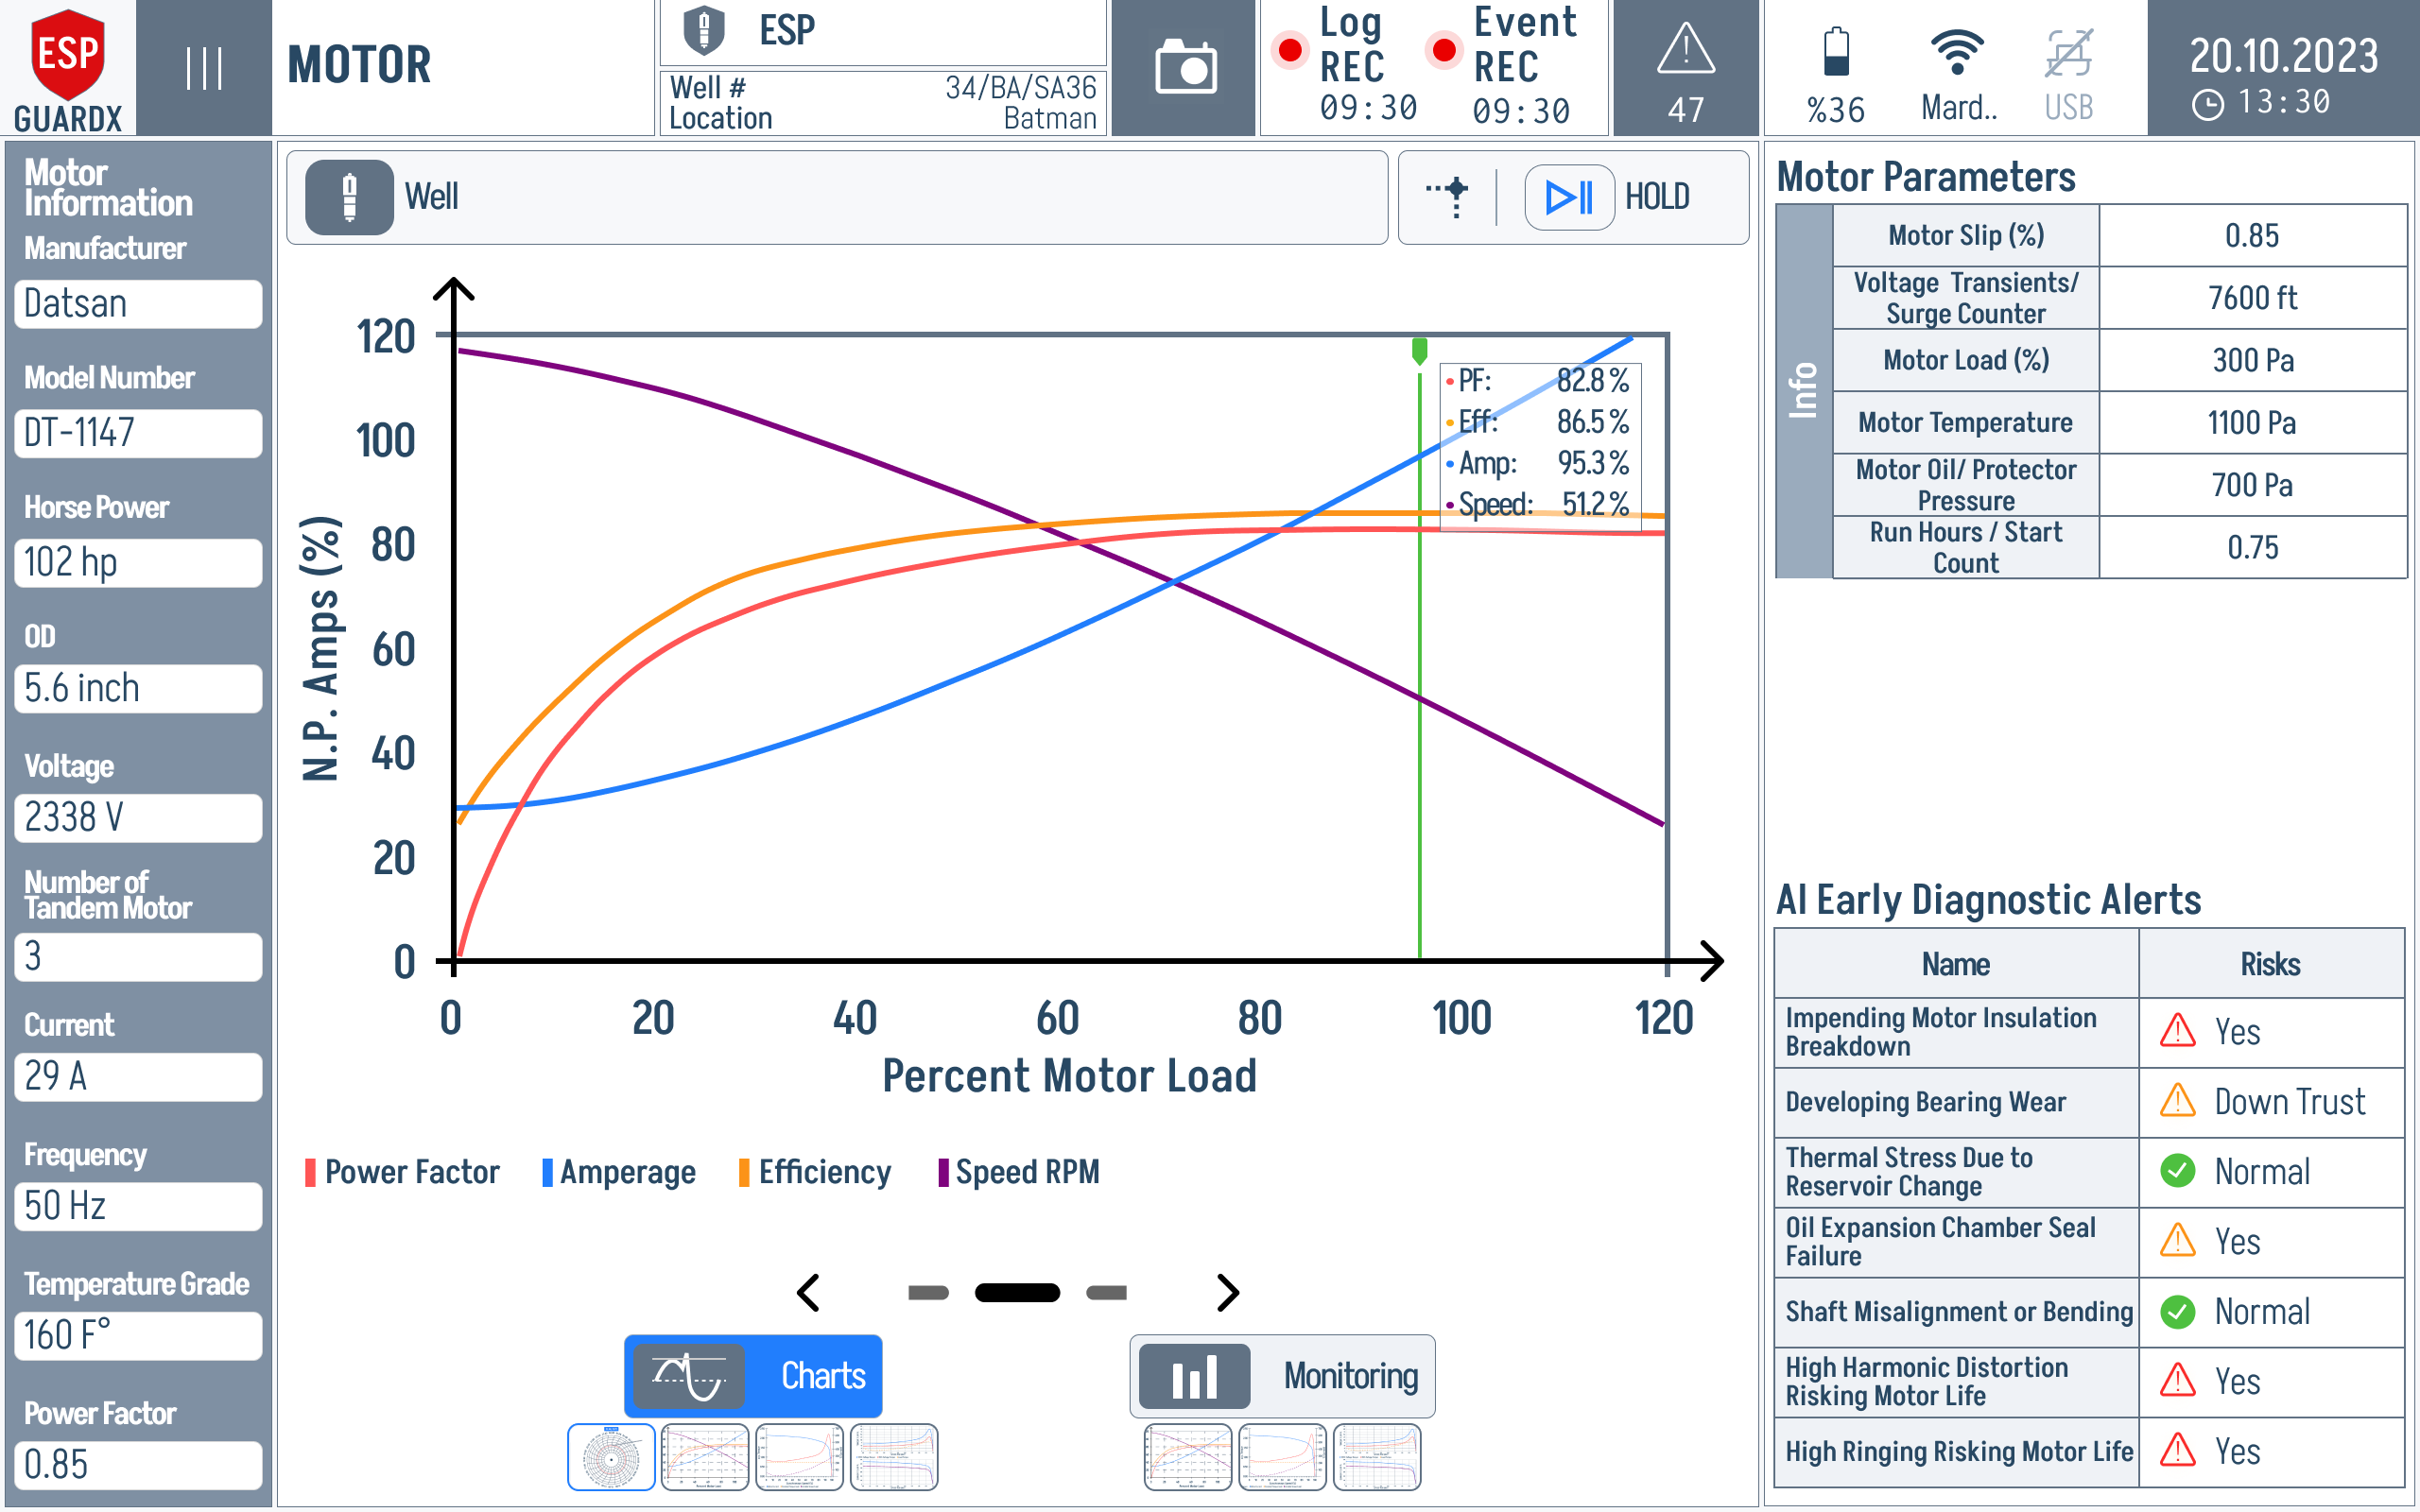
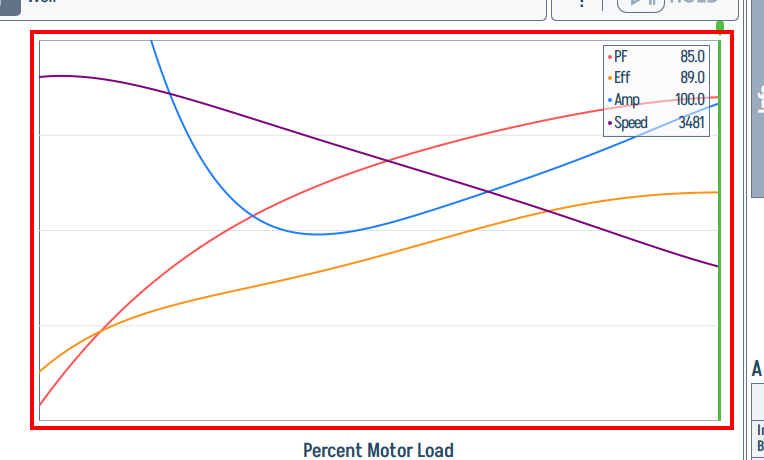
The curve area itself is shown at full size below — Power Factor, Efficiency, Amperage, and Speed RPM all share the same x-axis (% motor load).
The populated view includes the live vertical marker, a tooltip with current curve values, motor nameplate fields on the left, and diagnostic status on the right. Read the marker first, then compare the Power Factor, Efficiency, Amperage, and Speed RPM curves at that same load point.
Reading the chart:
| Curve | Colour | Tells you |
|---|---|---|
| Power Factor | red | How "clean" the load looks to the supply. Climbs toward 1.0 as load increases. |
| Efficiency | blue | How much of the input watts become shaft power. Sweet spot is usually 75–100% load. |
| Amperage | yellow | Current draw. Non-linear — even unloaded, the motor pulls magnetising current. |
| Speed RPM | dark | Mechanical speed. Drops slightly as load increases (slip). |
All four curves are generated by 5th-order polynomial interpolation (Horner's method) over the motor's nameplate operating points, so they stay smooth even when the live load jumps.
What to look for
Drop a vertical line at your current load (the live indicator on the chart). If Efficiency sits well below its peak and Amperage is above the curve, the motor is doing more work than it should be — a sign of mechanical drag, partial blockage, or a developing winding fault.
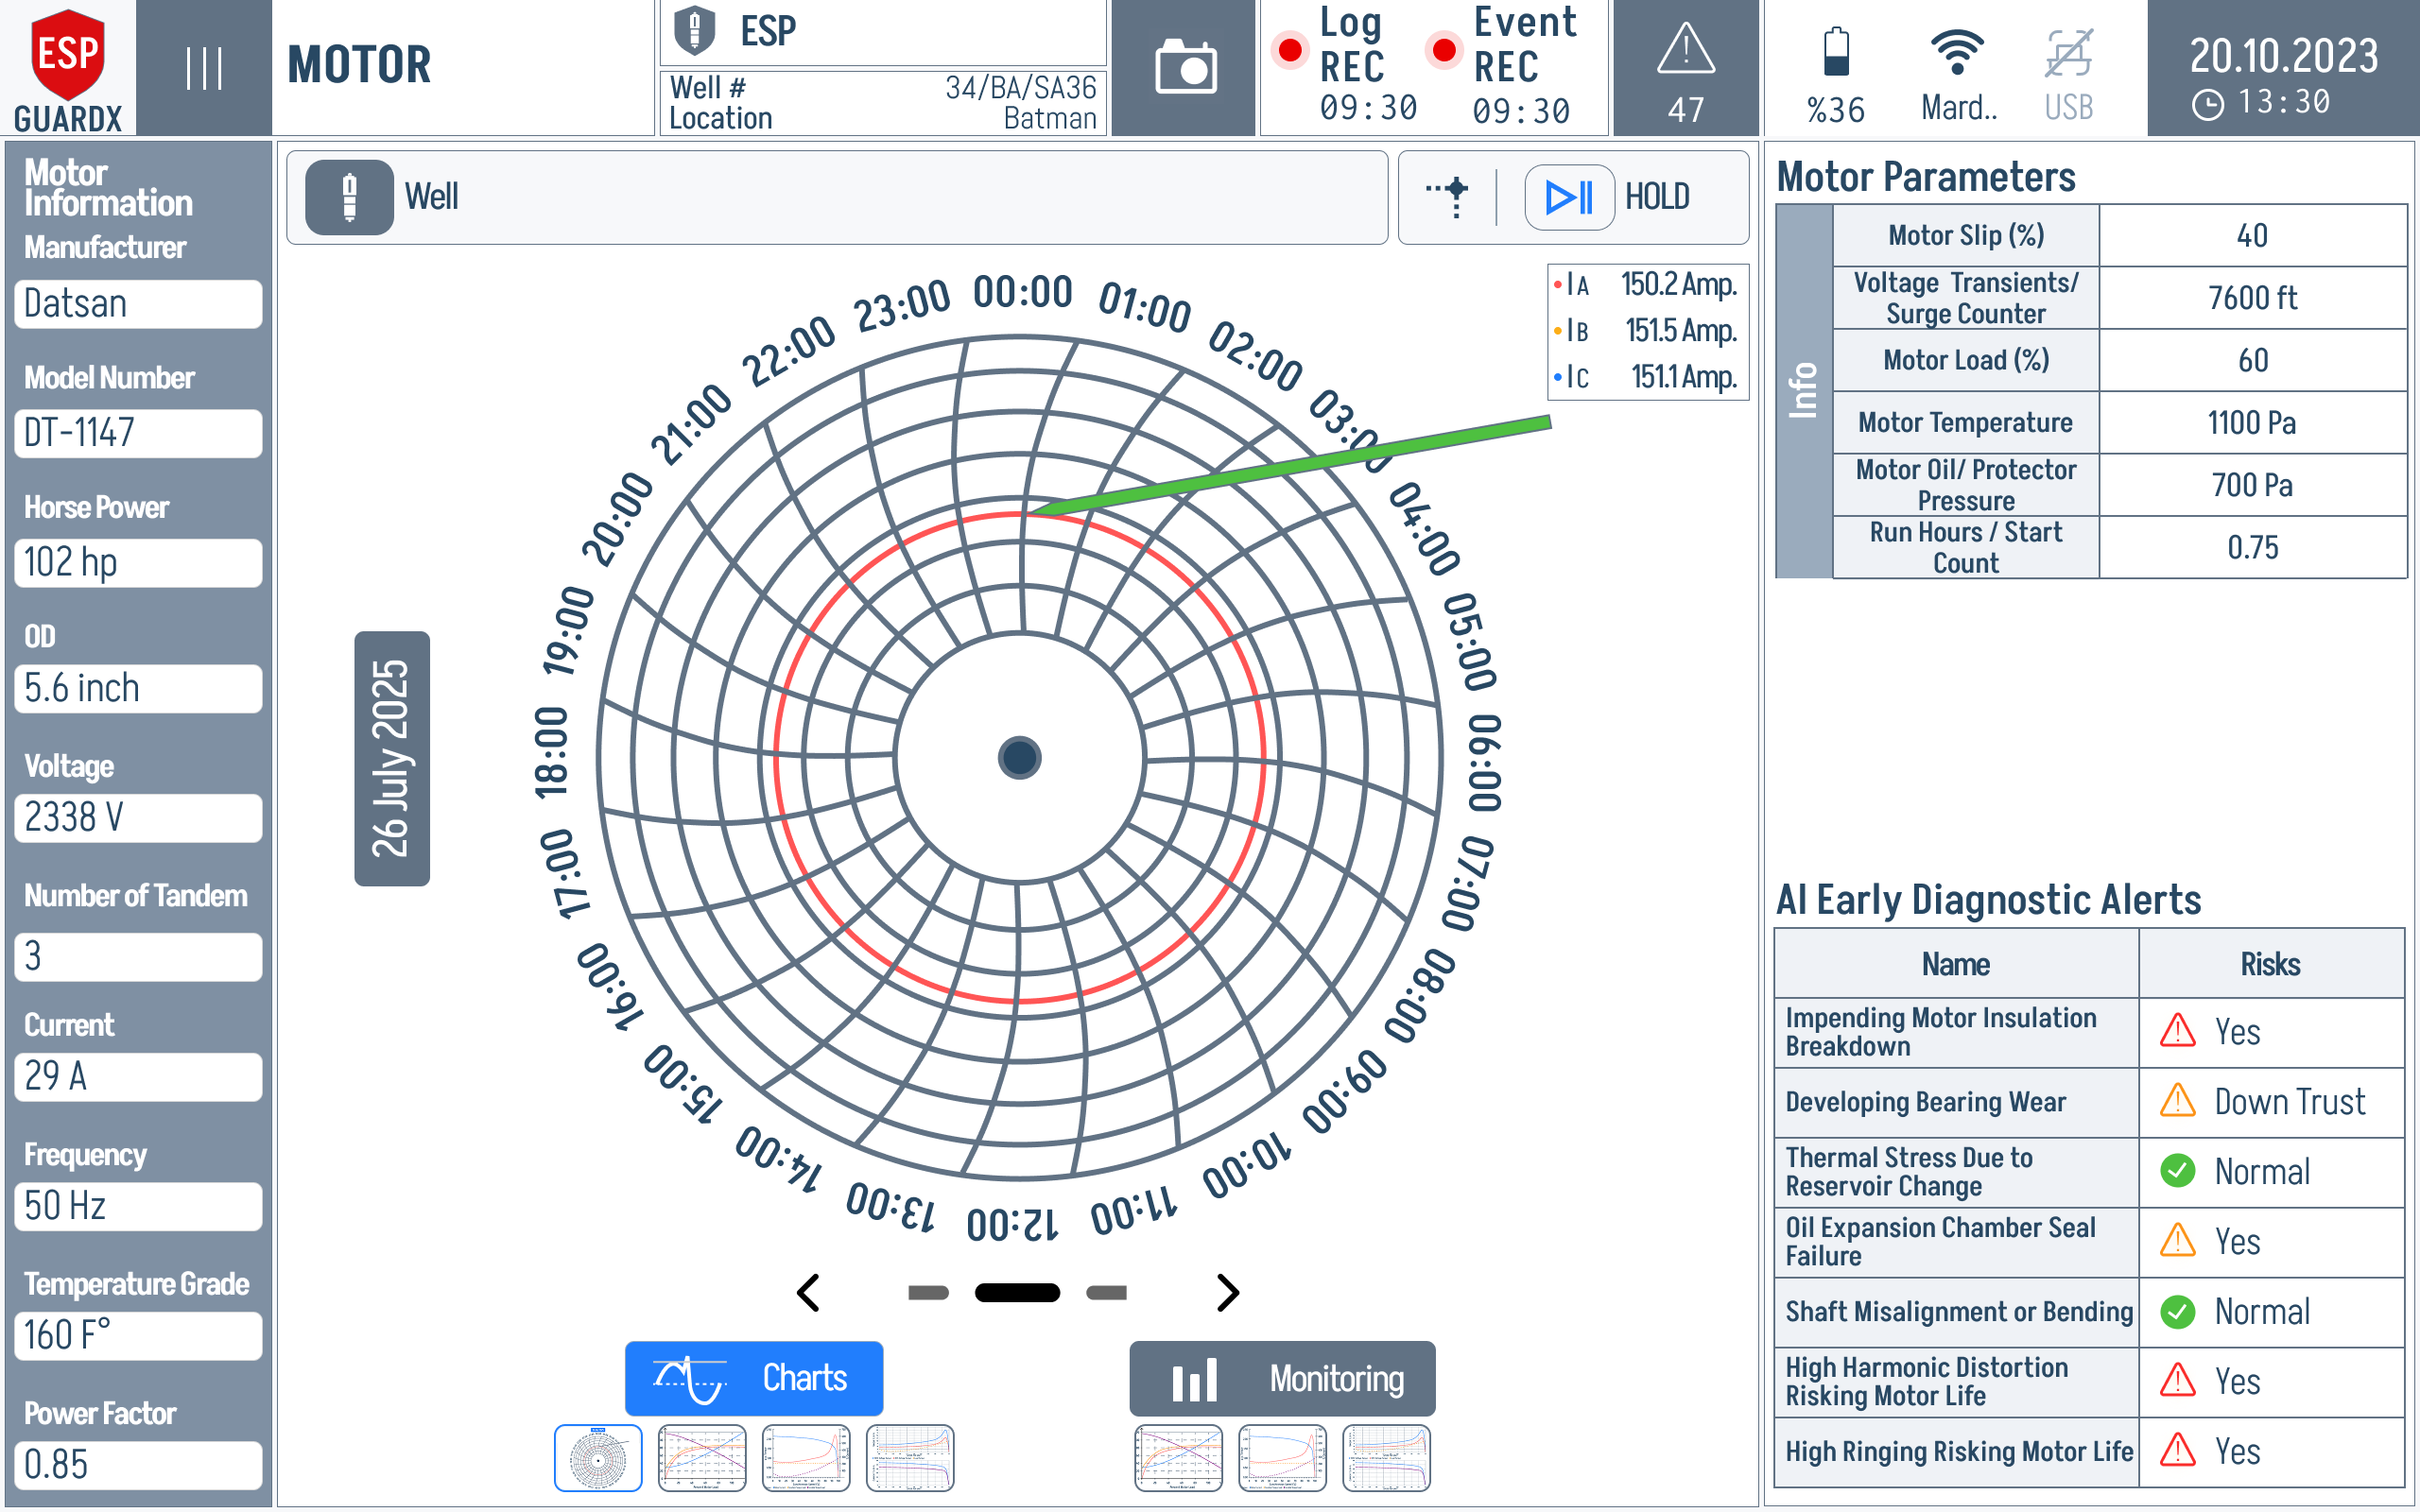
Motor Current Sampling
The Motor screen includes a circular / polar plot of the motor current waveform. This visualisation helps identify:
- Symmetrical waveform — healthy motor.
- Asymmetrical pattern — possible rotor bar issues, bearing wear, or eccentricity.
- Pulsating pattern — mechanical load variations.
The polar plot itself, zoomed:
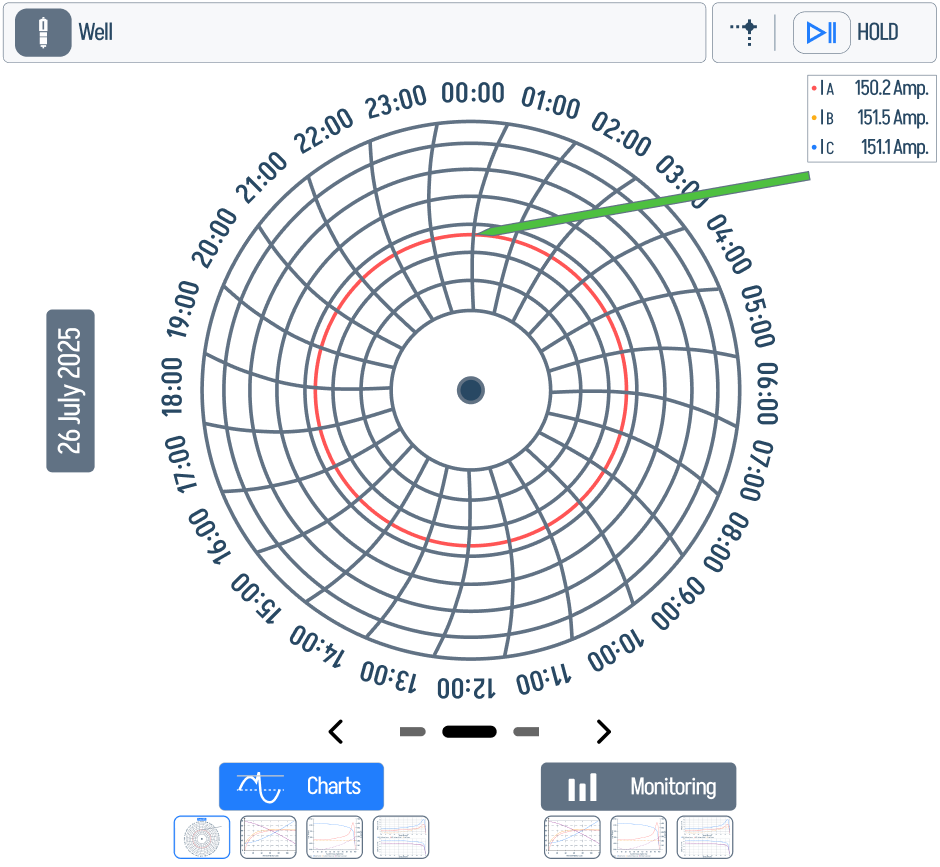
A live readout panel on the right of the Charts tab shows the per-phase RMS / peak amperage that drives the polar plot.
Phasor and Sequency Analysis
The Motor Monitoring tab adds voltage and current phasor diagrams plus voltage / current sequency plots — useful for spotting phase rotation issues, unbalance, and sequence-component anomalies at a glance.
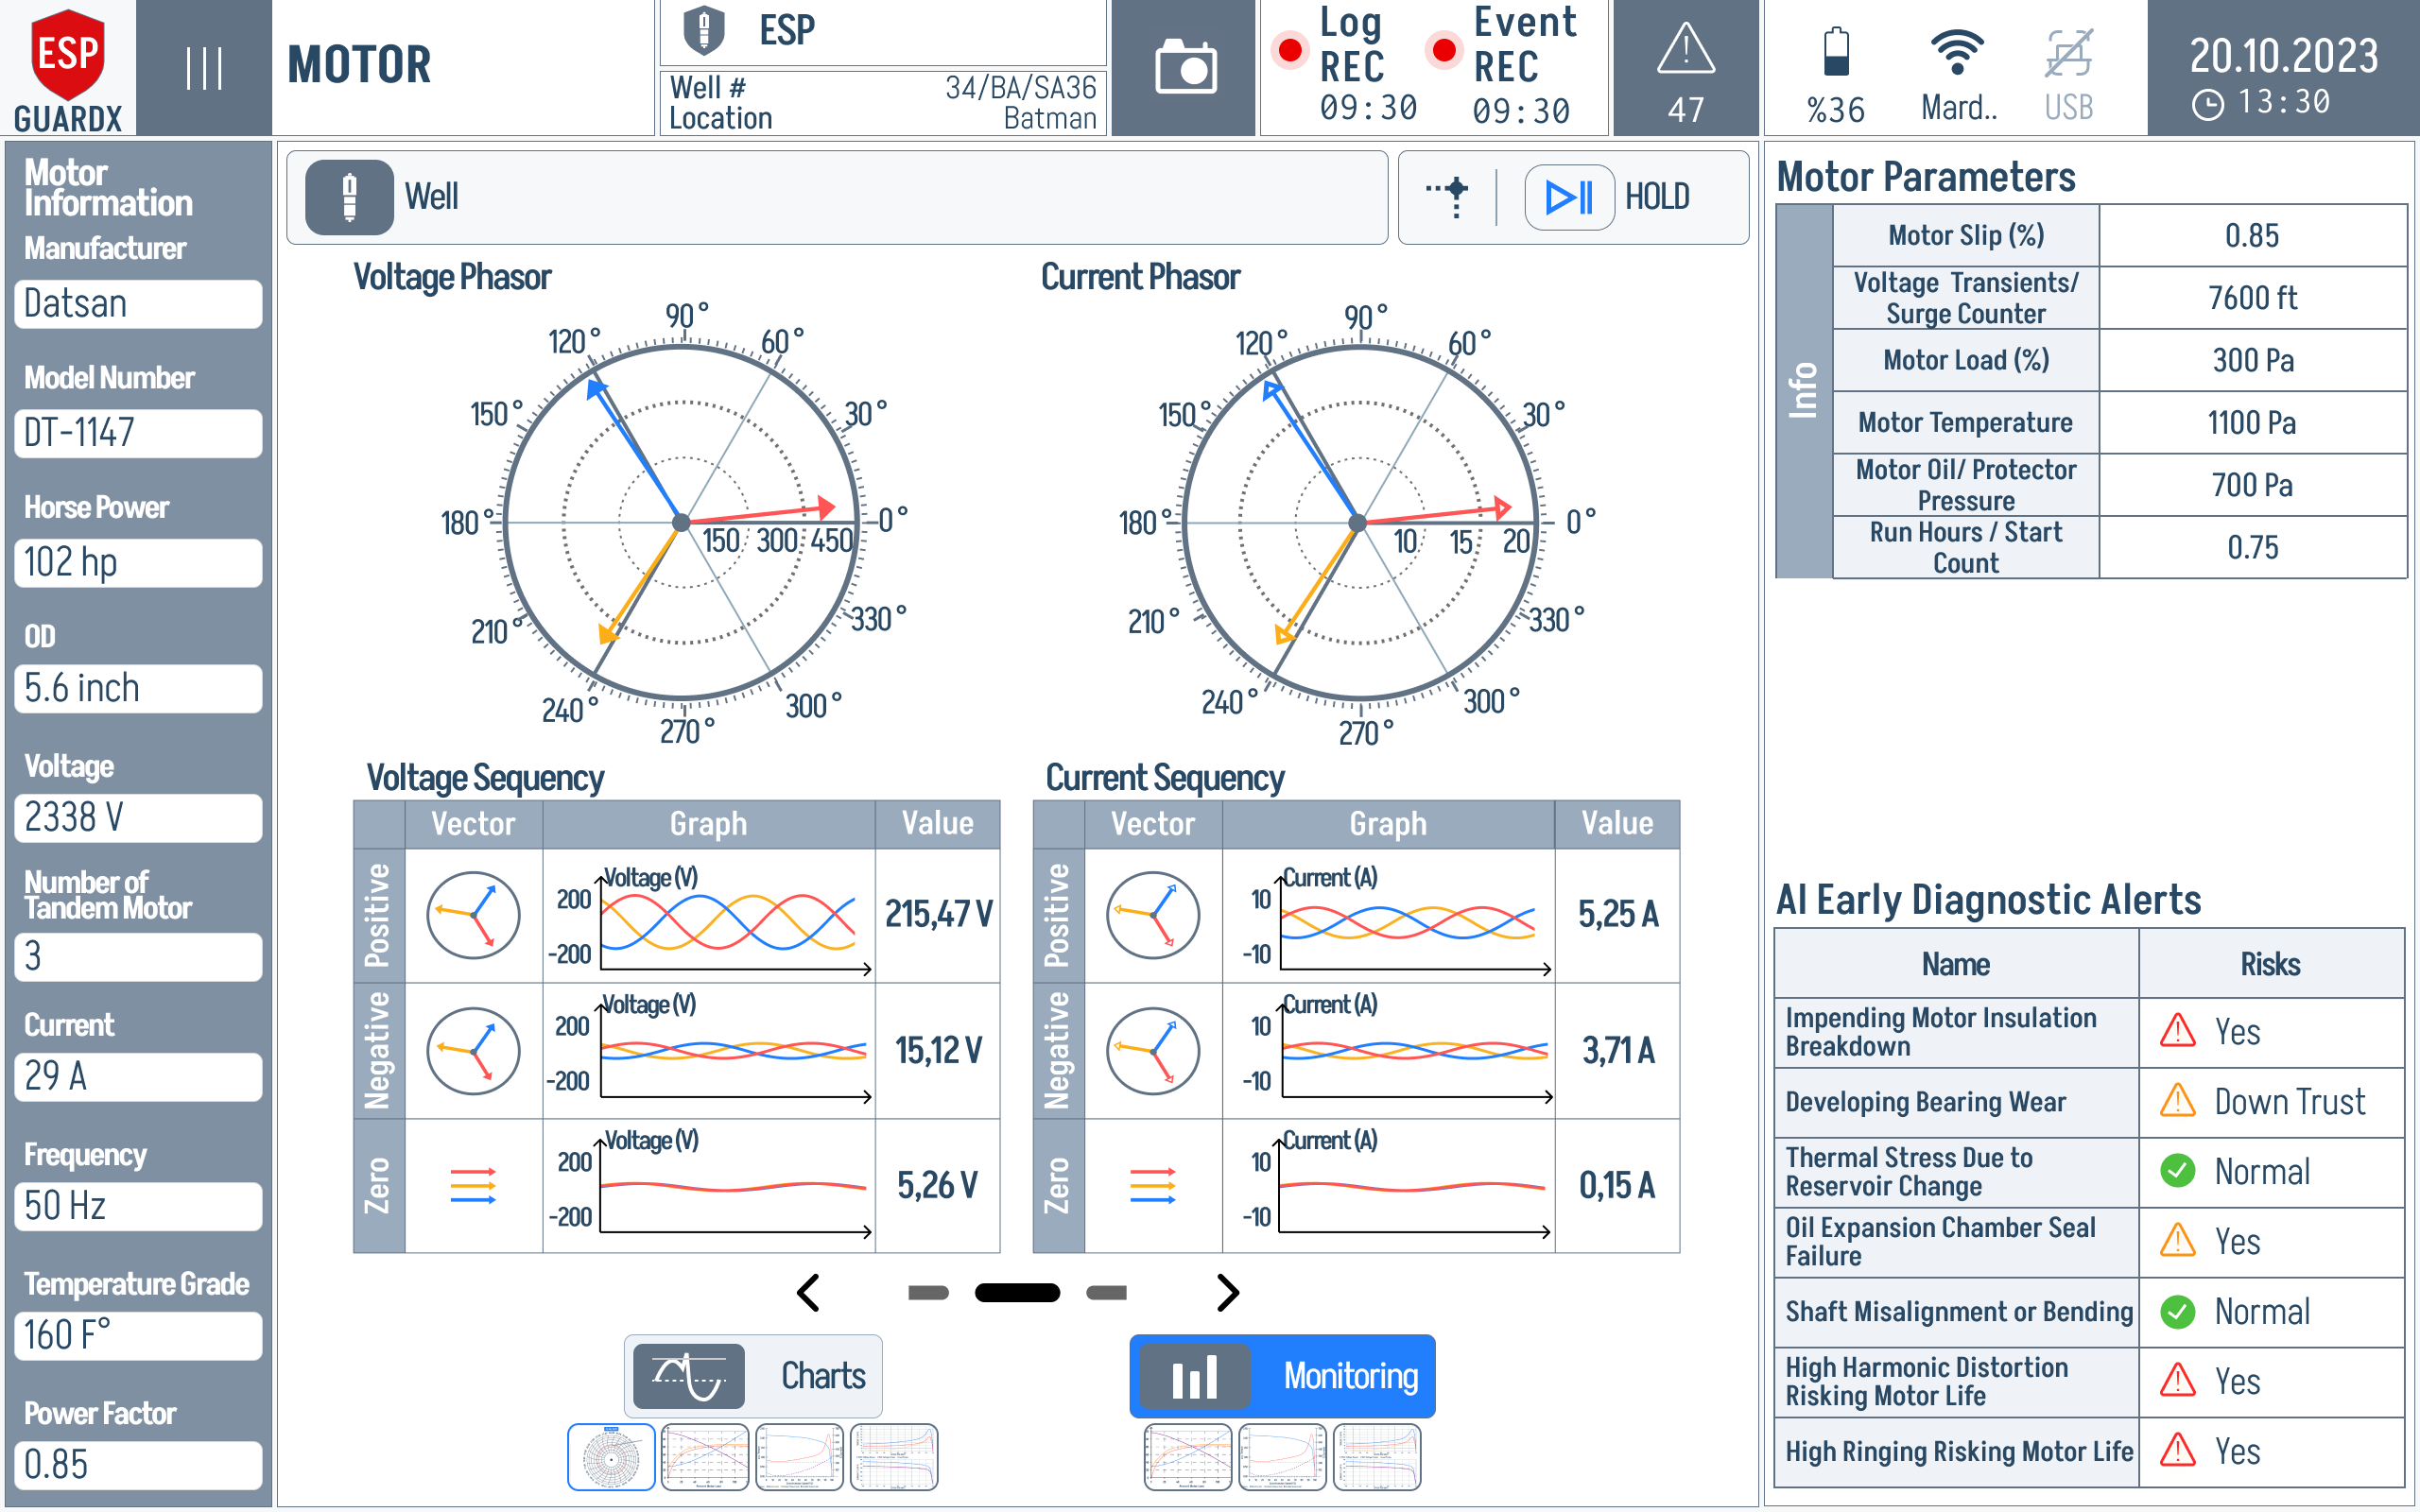
Reading top-to-bottom, left-to-right:
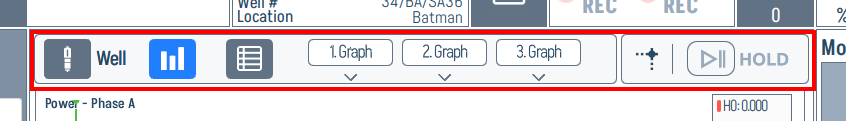
Top control bar — channel selector and acquisition controls (Hold / single-cycle / multi-cycle).

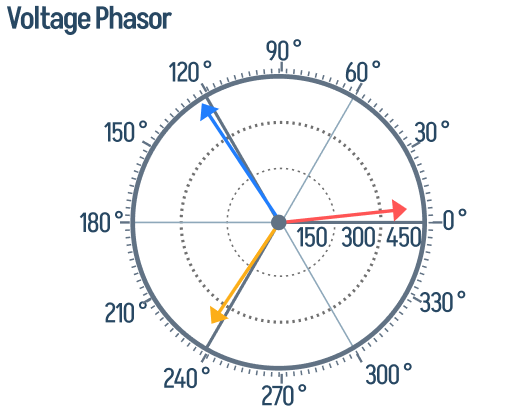
Voltage Phasor (top left) — three voltage vectors plotted on a polar grid. Equal-length vectors 120° apart = balanced supply.
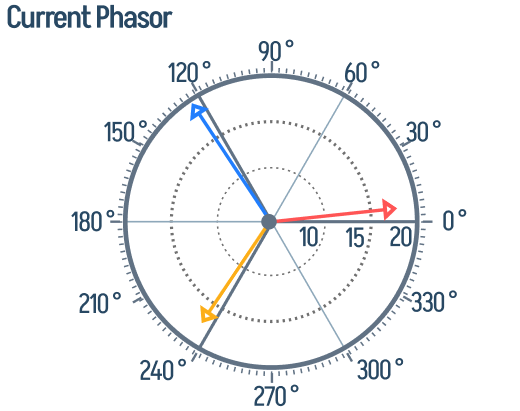
Current Phasor (top right) — same diagram for the three current vectors. The angle between the voltage phasor and the matching current phasor is the phase's power-factor angle.
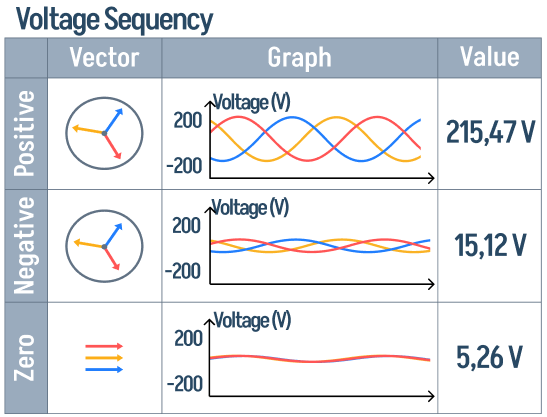
Voltage Sequency (middle left) — symmetrical-component decomposition of the voltage waveform: positive, negative, and zero sequence amplitudes shown as small bar charts with numeric magnitudes.
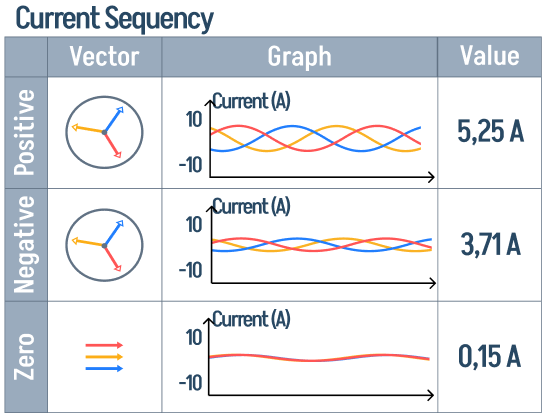
Current Sequency (middle right) — same decomposition for the current waveform. A non-zero negative-sequence current with healthy positive sequence is a classic indicator of rotor or supply unbalance.
Right column — Motor Parameters and AI Diagnostic Alerts, identical to the Monitoring tab so you don't lose context.
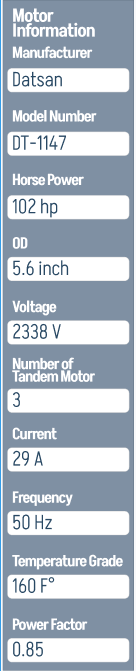
Left sidebar — the Motor Information block (Manufacturer, Model Number, Horse Power, OD, Voltage, Number of Tandem, Current, Frequency, Temperature Grade, Power Factor) is always visible on this screen.
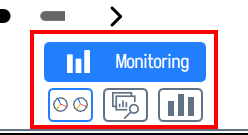
Charts / Monitoring tabs (bottom centre) — switch between the Phasor / Sequency view, the Performance Curves, the Polar Current view, and the Waveform view.

Motor Waveform Capture
The Monitoring tab also offers an oscilloscope-style multi-channel waveform view focused on the motor-side signals. The populated capture below shows live phase traces instead of an empty grid, so it can be used as a reference for what a running waveform view should look like.
The top control bar carries acquisition settings, Log REC and Event REC indicators, and the Hold button.
The waveform area is split into stacked channels, with each selected phase or signal rendered as its own time trace.
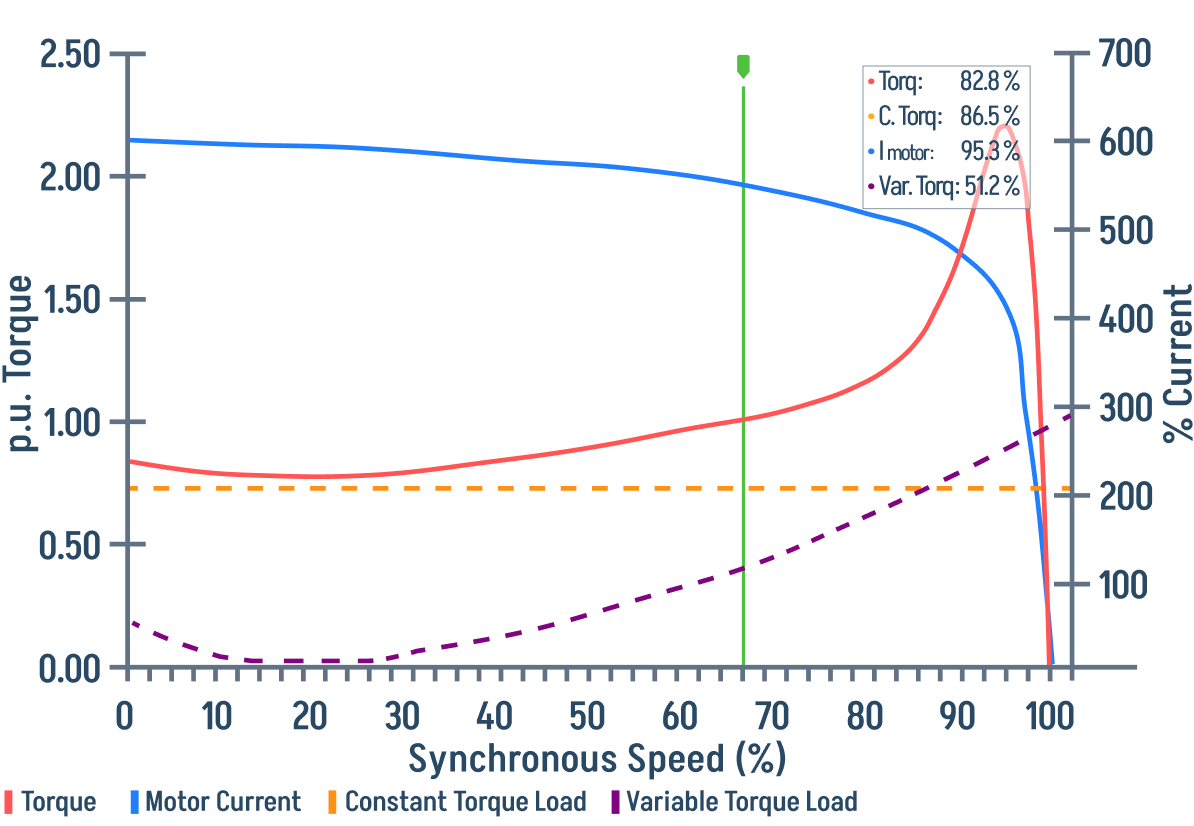
Torque vs. Synchronous Speed
The Charts tab plots Torque, Motor Current, Constant Torque Load, and Variable Torque Load against synchronous speed (%). Overlaying these curves lets you see how the motor's torque behaves across its full operating envelope.
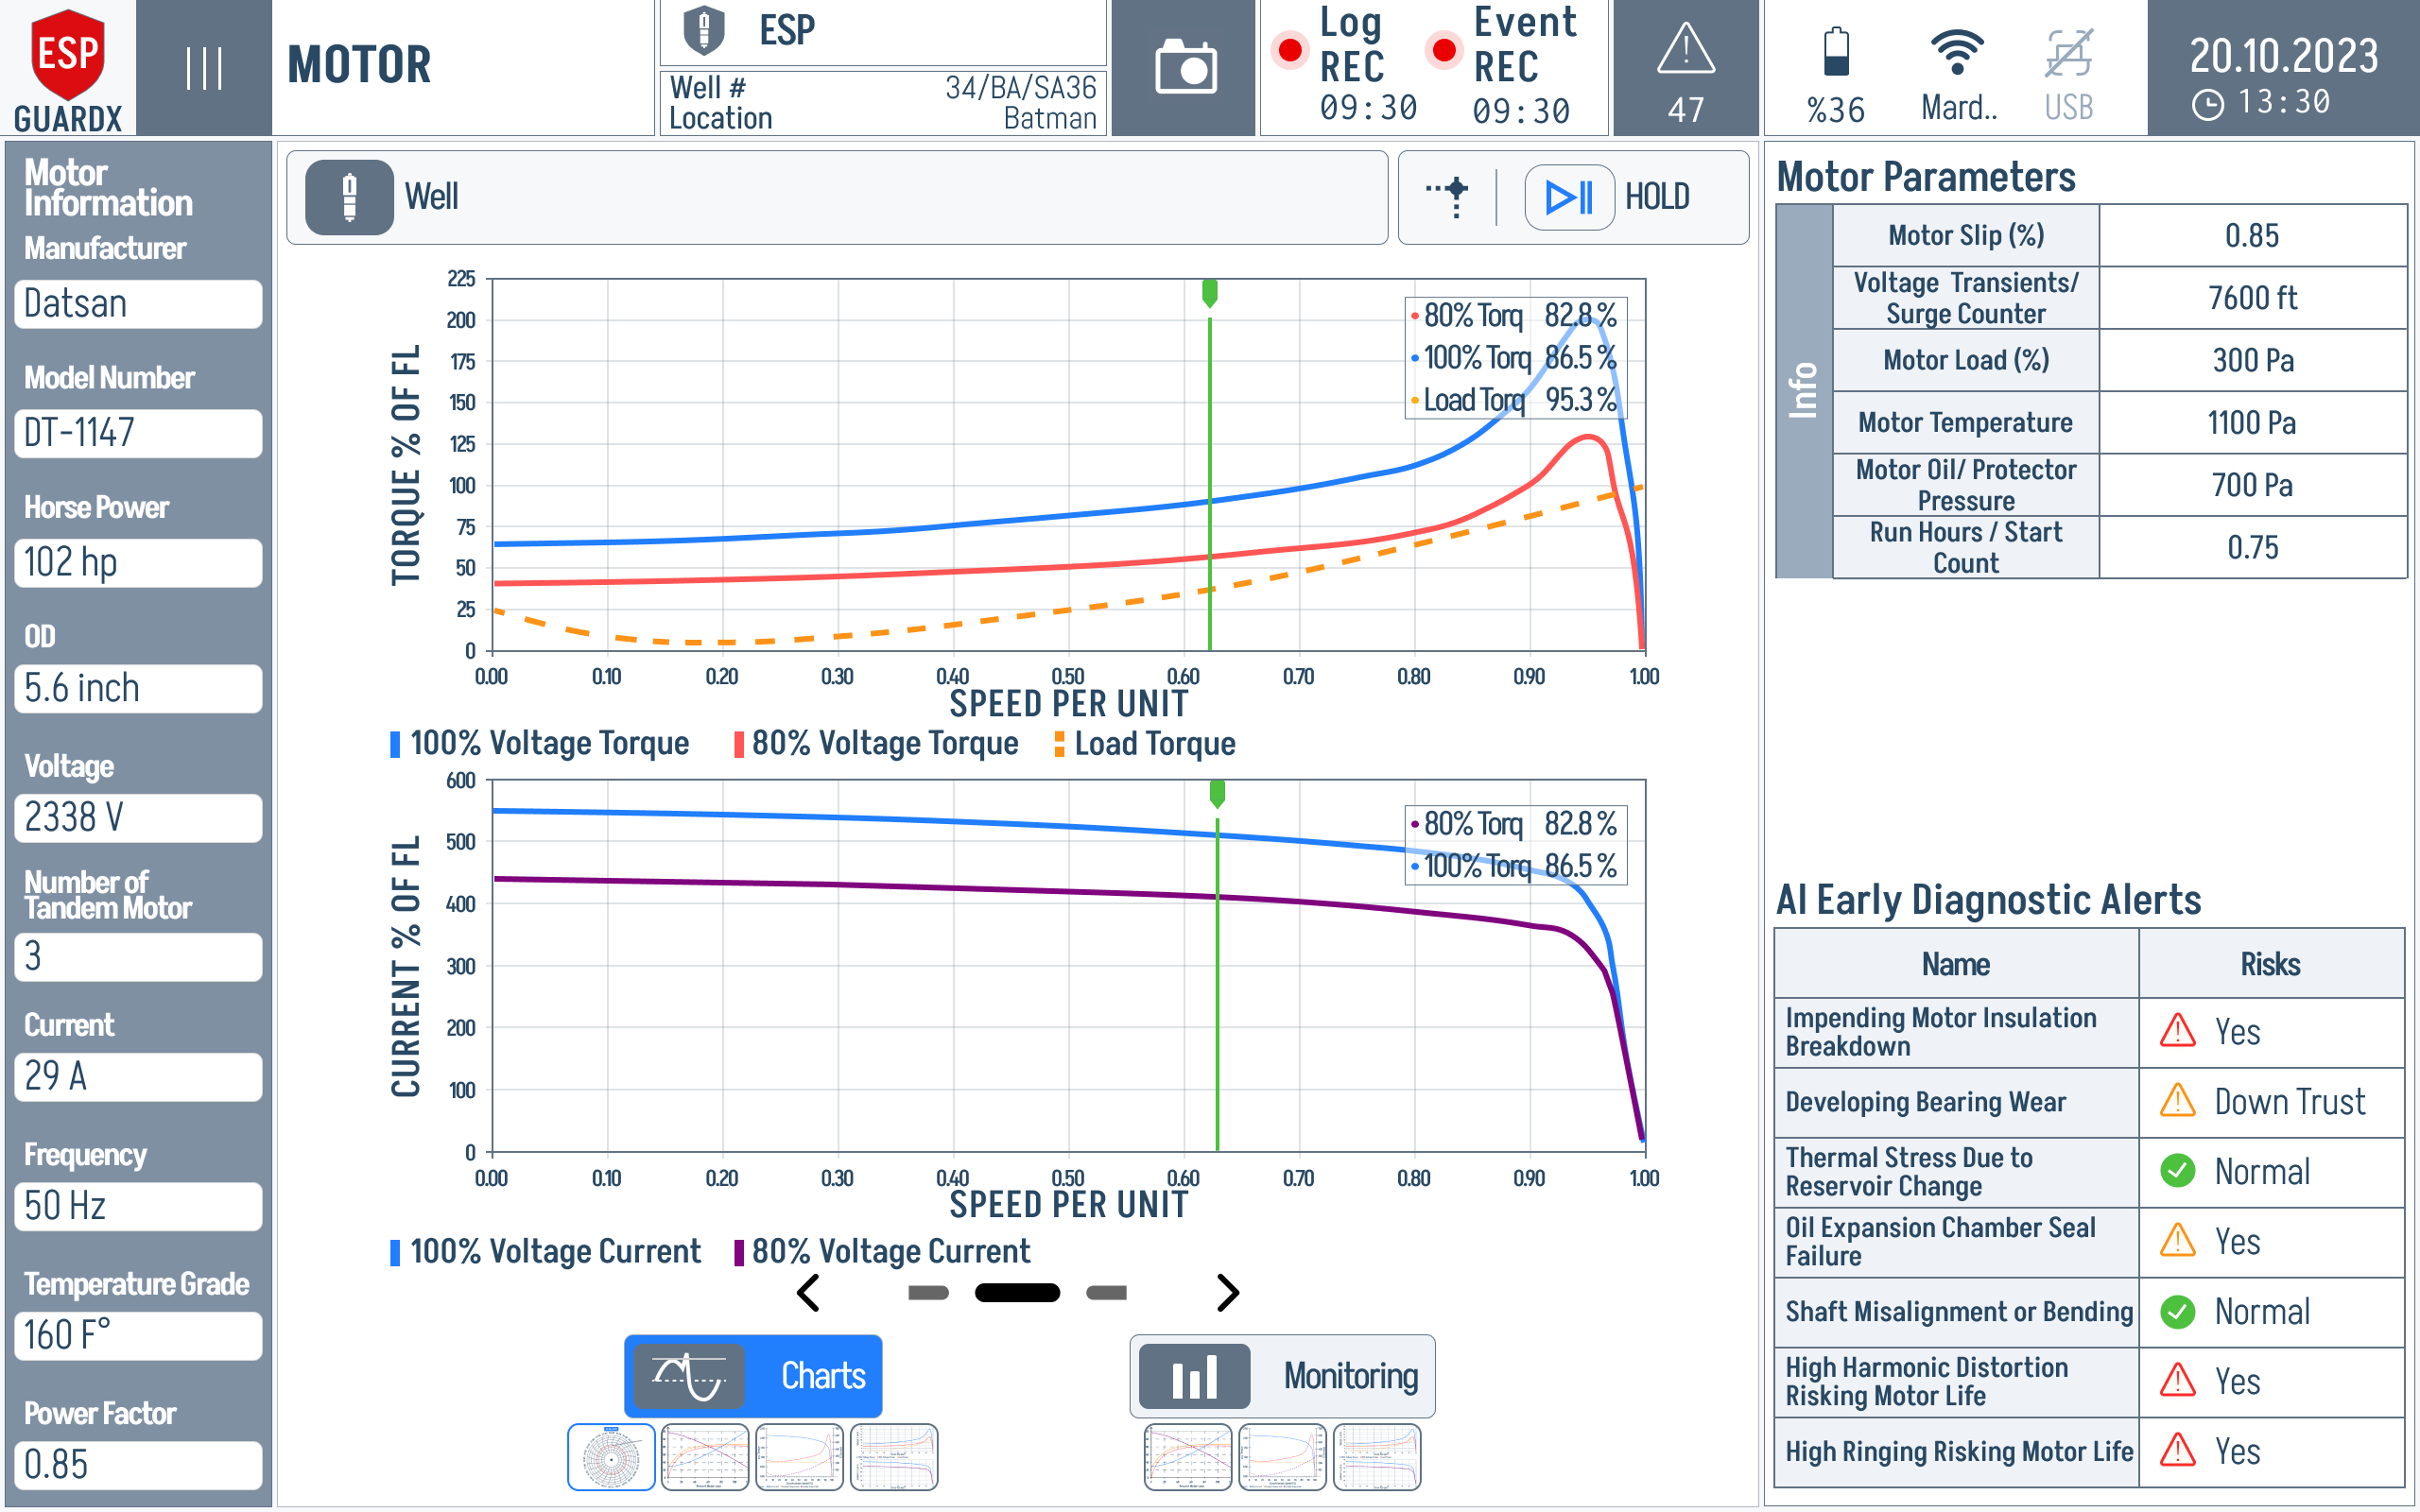
The green vertical marker shows the current operating point. Read the red torque curve and blue current curve together: rising torque with abnormal current is a practical early sign that the motor is being pulled away from its normal load envelope.
Zoomed into the chart region:
Monitored Motor Parameters
The following parameters are continuously monitored and can trigger events:
| Parameter | Description | Default Warn | Default Trip |
|---|---|---|---|
| Overcurrent | Current exceeds rated value | 110% | 120% |
| Undercurrent | Current drops below minimum | 10% | 5% |
| Voltage Unbalance | Phase voltage imbalance | 2% | 5% |
| Current Unbalance | Phase current imbalance | 3% | 7% |
| Under Voltage | Voltage below rated | 10% | 15% |
| Over Voltage | Voltage above rated | 105% | 110% |
| Motor Temperature | Winding temperature | 80 °C | 95 °C |
| Locked Rotor | Rotor not turning (high current, no speed) | 15% | 25% |
| Excessive Vibration | Vibration exceeds limits | 12% | 20% |
| Voltage THD | Voltage harmonic distortion | 5% | 8% |
| Current THD | Current harmonic distortion | 8% | 12% |
| Ground Fault | Leakage current to ground | 5% | 10% |
| Negative Sequence | Negative sequence current | 10% | 15% |
See Event Settings to customise these thresholds.