Harmonics Analysis
The Harmonics screen provides a detailed frequency-domain analysis of the voltage and current waveforms. Access it from the Waveforms > Harmonics section.
Reading the Harmonics Screen
The screen is organised left → centre → right:
- Left rail holds all the picker controls: layout, per-chart configuration, and the harmonic group/number selector.
- Centre area is the chart display, which renders the harmonic spectrum in whichever view mode you choose (Bar, Donut, or List).
- Right rail is a per-chart numeric breakdown — THD, fundamental, and the dominant harmonic levels.
The top header carries the device identity, recording status, and the toolbar that switches scales and toggles the live/hold mode.
Top Toolbar

Above the chart area sits the toolbar. From left to right: a grid toggle that overlays gridlines on the spectrum, a scale toggle (linear ↔ logarithmic), a pan/hand tool, a cursor for reading individual bars, and the HOLD button which freezes the running spectrum so you can study a single window.
Left Rail — Picker Controls
The entire left rail is a stack of picker controls, in this order from top to bottom: Layout → Layout View → 1st / 2nd / 3rd Chart → 18p Harmonic group → numeric harmonic grid. Each section is covered below.
Layout View — How the Spectrum Is Drawn
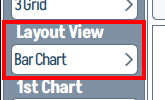
The Layout View dropdown picks the visualisation style. Tapping it opens the view selector:
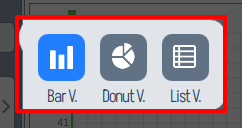
Three modes are available:
| Mode | Best for |
|---|---|
| Bar V. | Quickly comparing the magnitude of every harmonic order side-by-side per phase. |
| Donut V. | Showing the dominant harmonics as a share of the total (the centre reads THD %). |
| List V. | Tabular readout of every harmonic value — useful when you want exact numbers, not visual comparison. |
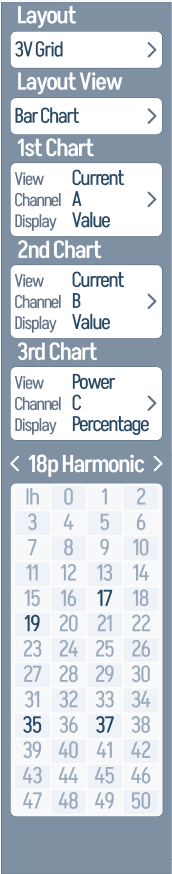
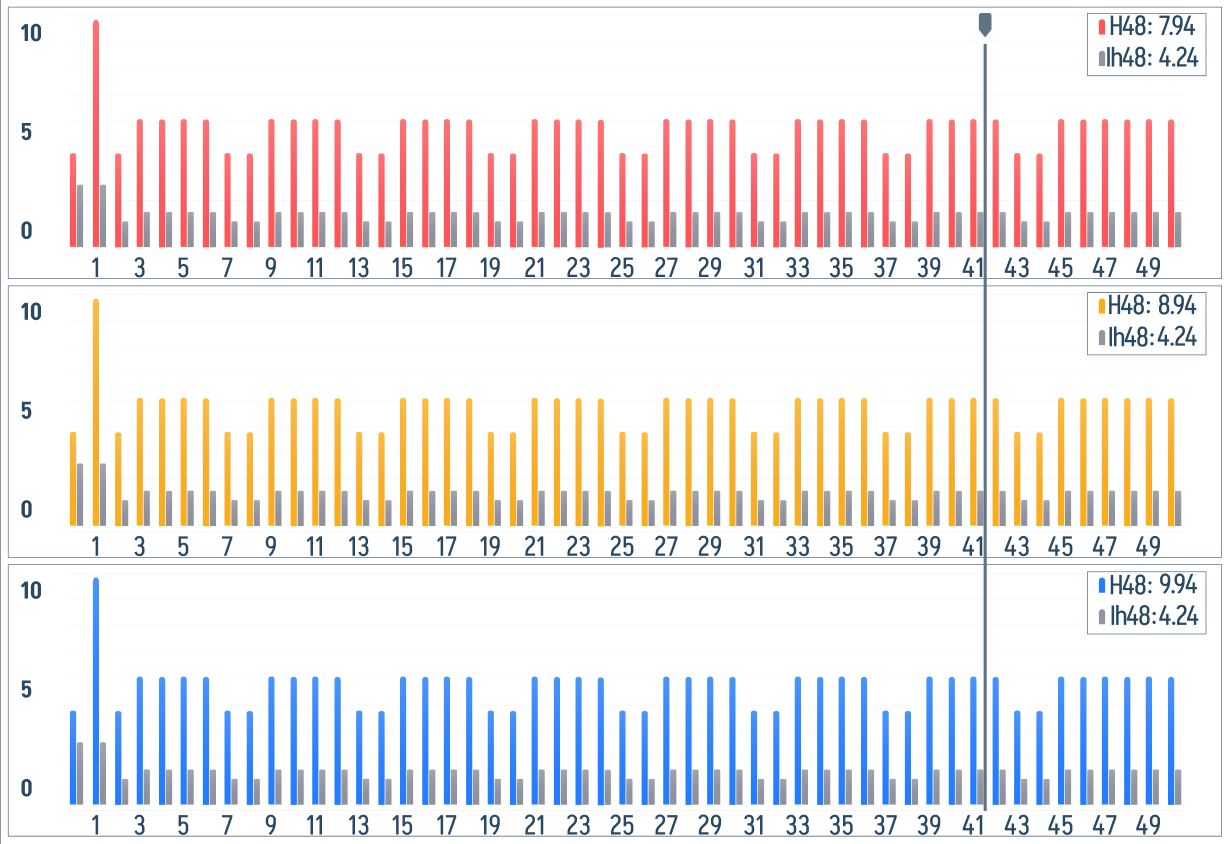
The Bar View layout shows one X/Y bar chart per phase, stacked vertically. Each chart's X-axis covers harmonic orders 0 → 50 and the Y-axis covers 0–102 % of the fundamental, with vertical bars rising from the X-axis at each harmonic order. Each chart shows a small H0 / Ih0 legend in its top-right corner — these are the DC component readouts. In a populated run, the dominant harmonic orders are visible immediately, while HOLD freezes the current window for inspection:
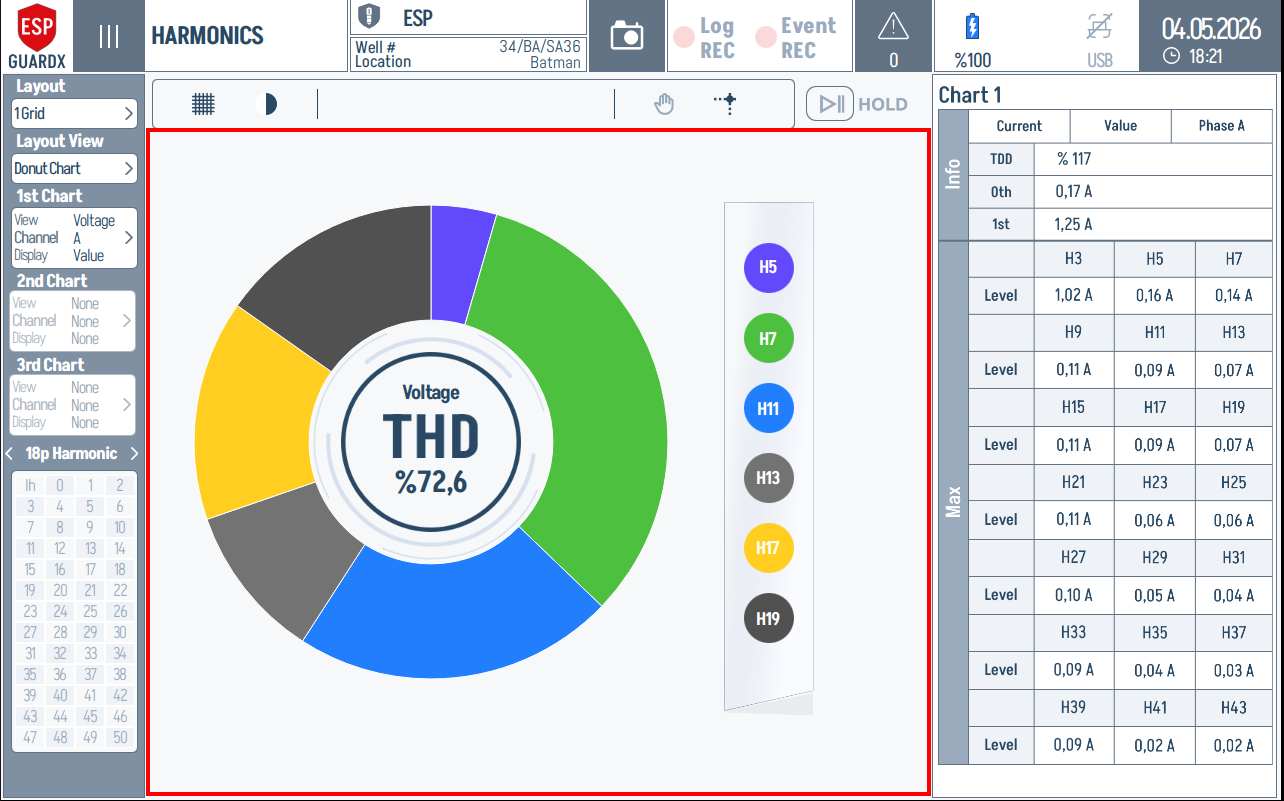
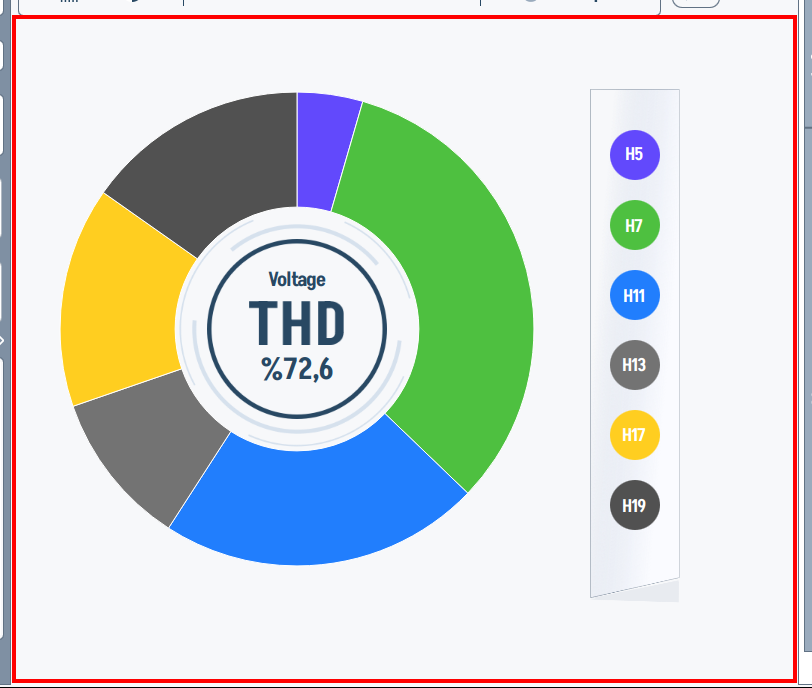
The Donut View condenses each phase into a single ring with the THD value in the centre and a side strip of the dominant harmonics (H5, H7, H11, H13, H17, H19):
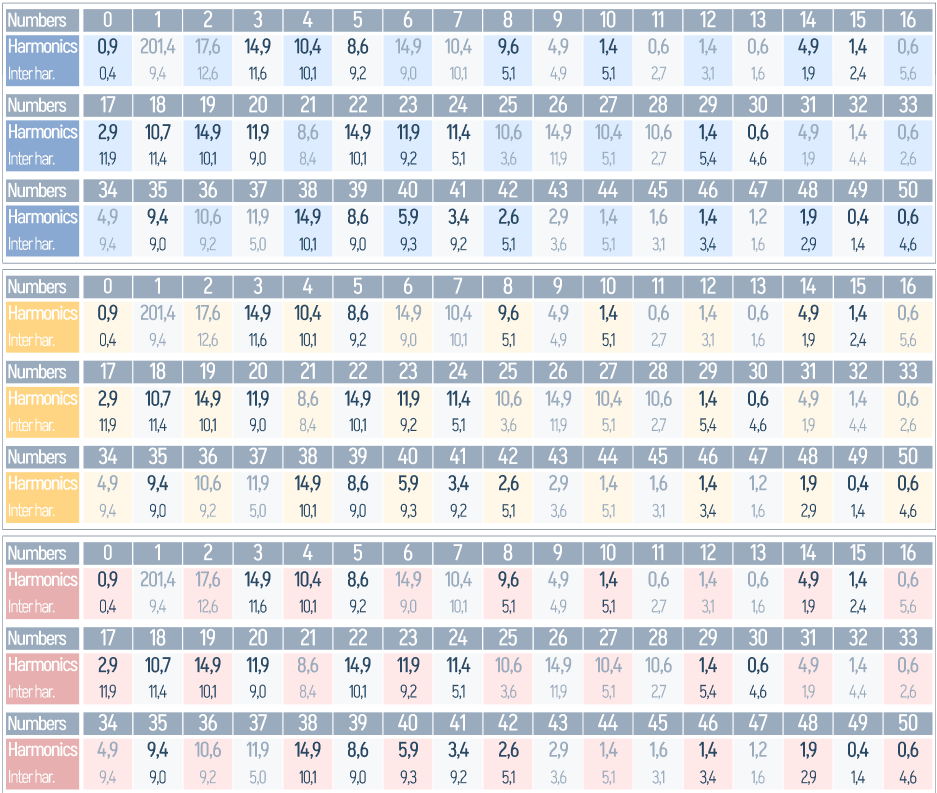
The List View lays the harmonics out as coloured cells per phase — one row per phase, one cell per harmonic order — making it easy to scan all three phases side-by-side and spot any cell that stands out. Use it when you need the same exact numeric readout shown in the right-side data tables, but arranged by harmonic order across the full chart area.
Per-Chart Configuration
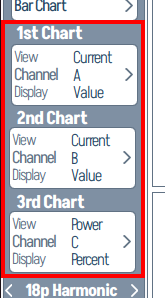
Each of the three chart slots (1st Chart, 2nd Chart, 3rd Chart) has its own row showing the active View, Channel, and Display mode. Tapping a row opens its picker:
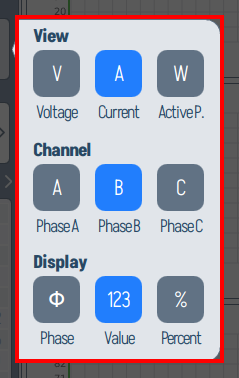
- View — selects the signal type: V (Voltage), A (Current), or W (Active Power).
- Channel — selects the phase: Phase A, Phase B, or Phase C.
- Display — selects the readout style: Φ (Phase angle), 123 (numeric Value), or % (Percent of fundamental).
A common setup is to assign each chart a different phase (Chart 1 → Phase A, Chart 2 → Phase B, Chart 3 → Phase C) so all three phases are visible at once.
Harmonic Group Selector
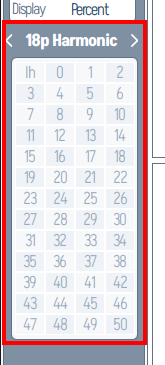
At the bottom of the left rail, the 18p Harmonic picker chooses which harmonic group is plotted, and the grid below selects the individual harmonic numbers (0–50) included in the analysis. Tapping the header opens a wider selector:
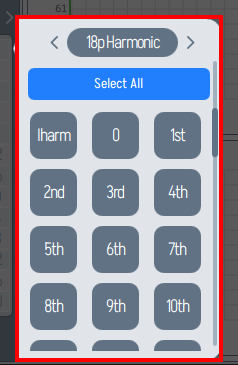
Use Select All to plot every harmonic up to the 50th, or tap individual orders (Iharm, 0, 1st, 2nd, … 10th, …) to focus on the ones that matter for your investigation. For VFD diagnostics, the typical picks are the 5th, 7th, 11th, and 13th.
Right Rail — Per-Chart Data Tables
Every chart has a matching numeric panel on the right rail with two sub-blocks:
- Info — the THD %, the 0th (DC) value, and the 1st (fundamental) value, plus the active phase label (Phase A/B/C) and view mode (Current / Value / Power / Percent).
- Max — the three highest-magnitude harmonics in the spectrum, shown as H3 / H5 / H7 (or whichever orders are dominant) with their Level in volts/amps.
This is the panel to read first when triaging — the headline THD plus the worst-offender harmonics tell you whether to dig further.
Harmonic Spectrum Display
ESP-GUARDX analyzes harmonics up to the 50th harmonic (e.g., up to 3,000 Hz on a 60 Hz system). The display shows:
- Bar chart of individual harmonic magnitudes (as a percentage of the fundamental)
- Fundamental frequency component (1st harmonic = 100% reference)
- Per-phase breakdown -- Harmonics for each of the three phases
Key Harmonic Orders
| Harmonic | Frequency (at 60 Hz) | Common Source |
|---|---|---|
| 1st | 60 Hz | Fundamental (power supply) |
| 3rd | 180 Hz | Single-phase nonlinear loads |
| 5th | 300 Hz | 6-pulse VFD drives |
| 7th | 420 Hz | 6-pulse VFD drives |
| 11th | 660 Hz | 12-pulse VFD drives |
| 13th | 780 Hz | 12-pulse VFD drives |
THD Summary
At the top of the Harmonics screen, the following summary values are displayed:
- Voltage THD (%) -- Per-phase and average
- Current THD (%) -- Per-phase and average
Recommended Limits
| Parameter | IEEE 519 Limit |
|---|---|
| Voltage THD | < 5% |
| Individual Voltage Harmonic | < 3% |
| Current TDD | Depends on ISC/IL ratio |
IEC 61000-4-30 Compliance
The harmonic analysis engine implements:
- Gapless window analysis -- No gaps between measurement windows, ensuring complete signal capture
- 5th harmonic RMS buffering -- Smooth, stable 5th harmonic readings (critical for VFD monitoring)
- Equation 2 calculations -- Standard-compliant harmonic magnitude computation
- Pass/fail testing -- Automatic comparison against standard harmonic limits
Interpreting Harmonic Data
High Voltage THD
Indicates the power supply is distorted, which may be caused by:
- VFD switching
- Other nonlinear loads on the same bus
- Transformer saturation
Action: Check VFD filter settings; consider adding line reactors or harmonic filters.
High Current THD
Indicates the motor is drawing non-sinusoidal current, which causes:
- Additional motor heating (derating required)
- Increased cable losses
- Potential interference with protection relays
Action: Verify VFD pulse configuration; consider upgrading from 6-pulse to 12-pulse or 18-pulse.