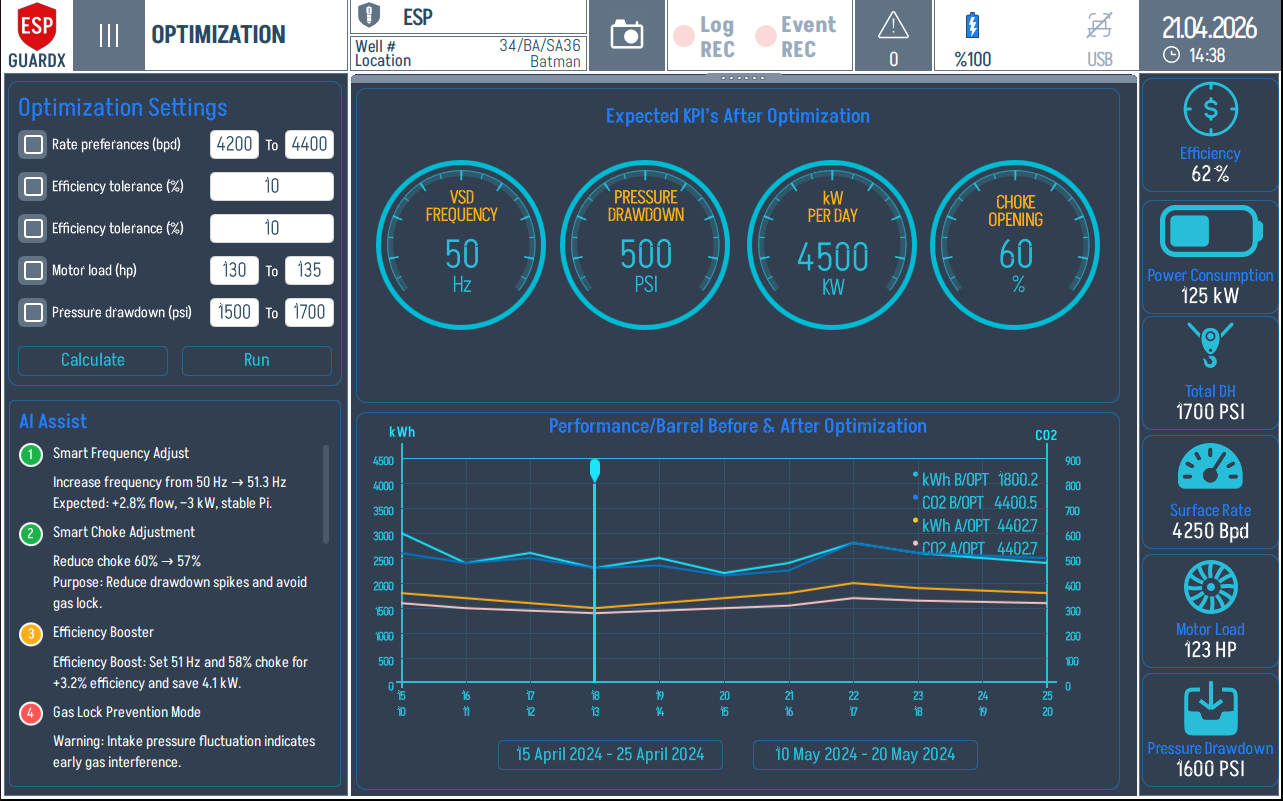
Optimization Screen
The Optimization screen turns ESP-GUARDX from a passive monitor into a recommender: it ingests live plant data, runs an AI optimization against the pump's design curves, and proposes specific adjustments — raise frequency to 51.3 Hz, reduce choke from 60% to 57% — to improve flow, efficiency, or energy use.
Reading the Optimization Screen
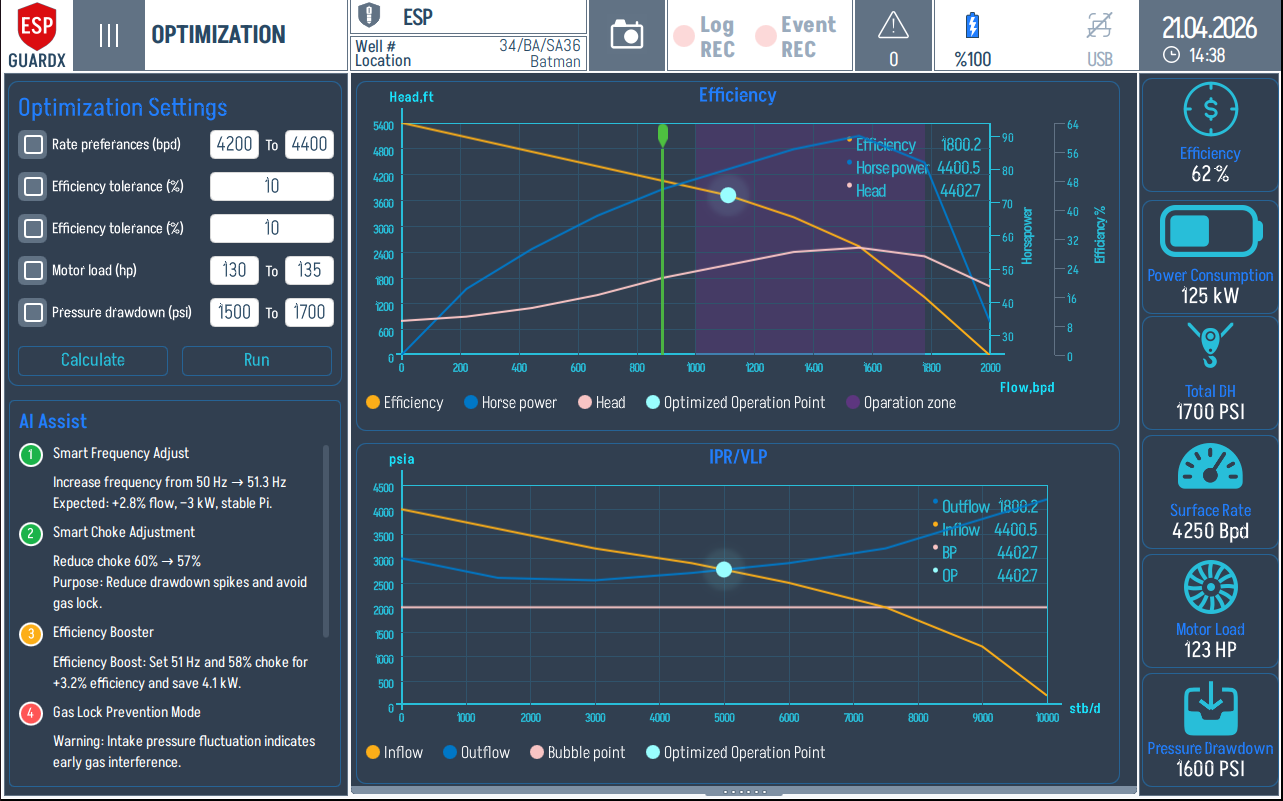
The layout is constraints on the left, charts in the middle, live plant state on the right. Set the bounds and tolerances on the left, watch the charts to see whether the optimized point stays inside them, and use the right strip to confirm the live state matches the assumed inputs.
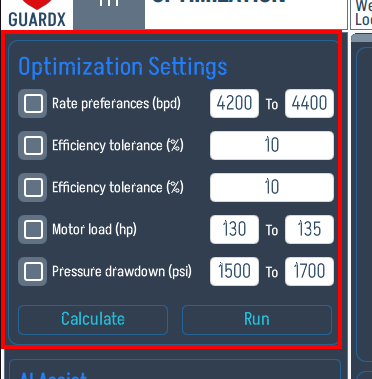
Optimization Settings (left, top)
| Setting | Description |
|---|---|
| Rate preferences (bpd) | Lower / upper bound on target production rate |
| Efficiency tolerance (%) | Acceptable efficiency band around the best point |
| Flow tolerance (%) | Acceptable flow band |
| Motor load (hp) | Lower / upper motor-load bounds |
| Pressure drawdown (psi) | Allowable drawdown limits |
Press Run to recompute; Calculate runs without applying. The optimizer respects every bound — it will fail to converge rather than violate them.
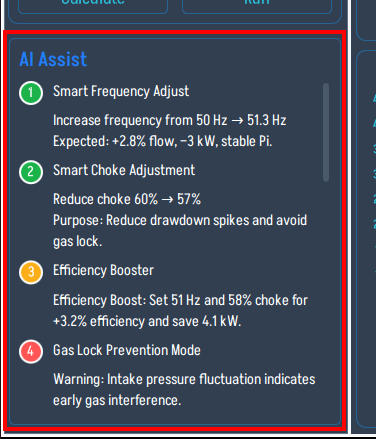
AI Assist (left, bottom)
Each numbered card in the AI Assist list is one suggested change in plain language, with the predicted gain. Typical entries:
- Smart Frequency Adjust — "Increase frequency from 50 Hz → 51.3 Hz. Expected: +2.8% flow, −3 kW, stable Pi."
- Smart Choke Adjustment — "Reduce choke 60% → 57%. Purpose: reduce drawdown spikes and avoid gas lock."
- Efficiency Booster — "Set 51 Hz and 58% choke for +3.2% efficiency and save 4.1 kW."
- Gas Lock Prevention Mode — warning-style entry surfacing intake-pressure fluctuation.
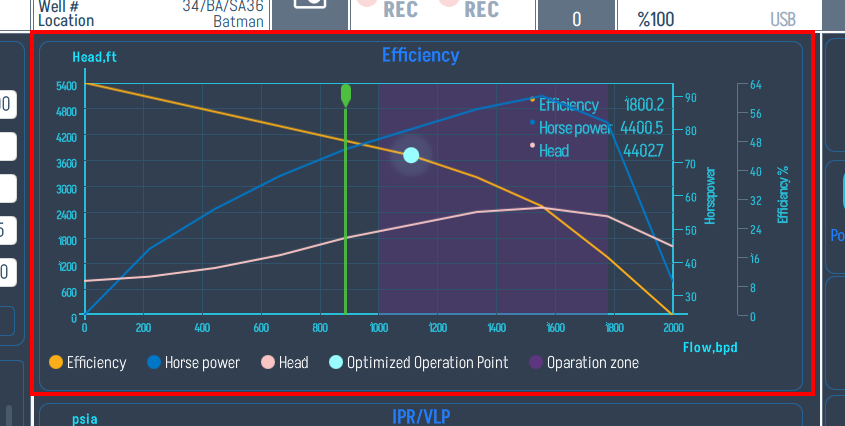
Efficiency / Head / Horsepower Chart (top centre)
The upper chart overlays Efficiency, Horse power and Head vs. flow rate, with two markers:
- Current operating point — the live position on the curves as the well is running today.
- Optimized target — where the AI is recommending you move the operating point.
The shaded box is the Operation Zone — the safe band where the pump is happiest. A good recommendation moves the dot toward higher efficiency while staying inside the box; if a recommendation pulls the dot outside the box, the AI Assist text will flag it.
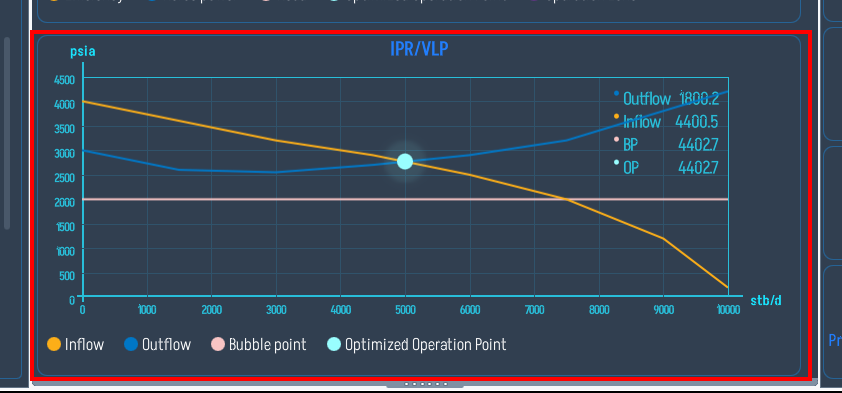
IPR / VLP Chart (bottom centre)
The lower chart is the classic well-inflow / tubing-outflow plot in psia vs. stb/d. The intersection of the Inflow (orange) and Outflow (cyan) curves is the well's natural operating point. The optimizer aims for an Optimized Operation Point that respects the bubble-point line so you don't gas-lock the pump.
Live Operating Metrics (right)
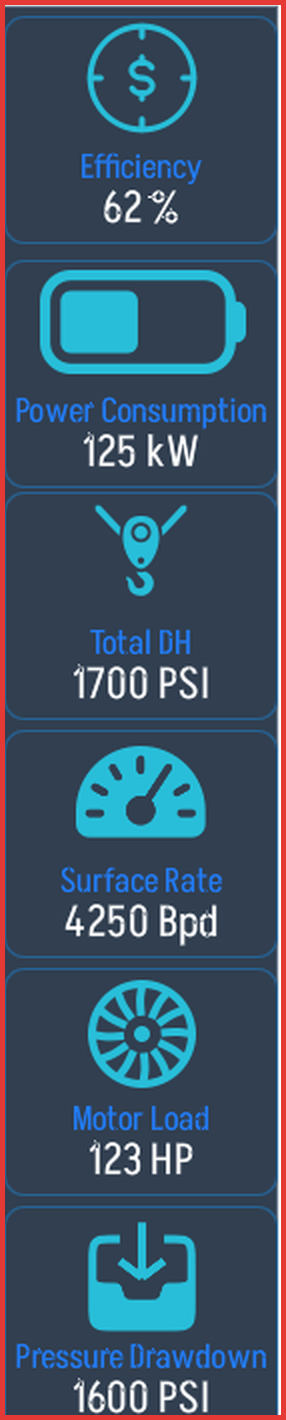
The right column is the current state of the plant — Efficiency, Power Consumption (kW), Total DH (PSI), Surface Rate (Bpd), Motor Load (HP), Pressure Drawdown (PSI). Match these against the inputs you set in Optimization Settings: if they don't agree, the optimization is being run on stale numbers and you should re-import live readings before trusting the result.
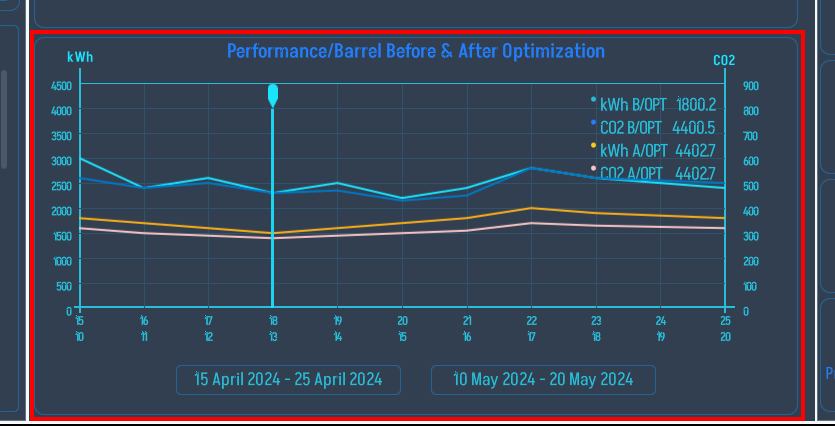
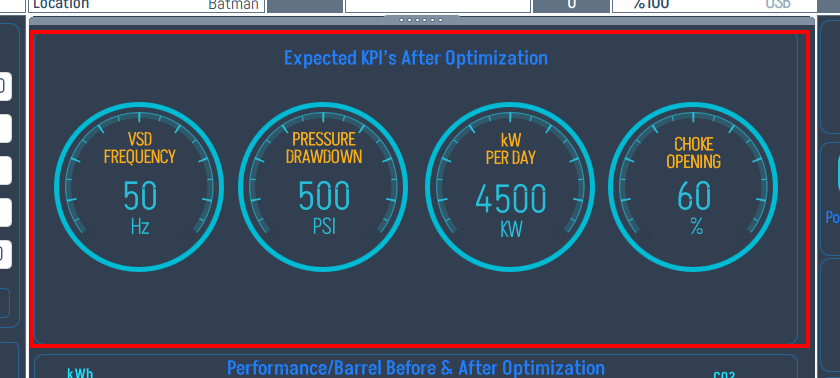
Before / After Results
Tapping Apply (or reviewing a saved run) brings up the before/after comparison. Expected BPs After Optimization summarizes frequency, drawdown, BPD, and choke %, and the Performance / Barrel Before & After Optimization charts plot the improvement over time.
The same screen broken into its working zones:
Optimization Settings (top left) — the same constraints panel as the live screen, displayed alongside the result so you can confirm the bounds the optimizer was working under.
AI Assist (bottom left) — the recommendations that produced this result, retained for traceability.
Expected KPI cards (top centre) — Frequency, Pressure Drawdown, BPD, Choke after optimization, in big readouts so the change is unmistakable.
Performance / Barrel Before & After Optimization (bottom centre) — production rate trend pre- and post-optimization, on a shared time axis so the lift is visible.