Power Quality
The Power Quality screen is the supply-side health view: it counts EN 50160-style events, scores the overall risk to the motor, and tells you in plain language what the harmonics are doing. Access it from the Status tab by selecting the Power Quality sub-tab.
Reading the Power Quality Screen
The screen has five working areas arranged left → centre → right.
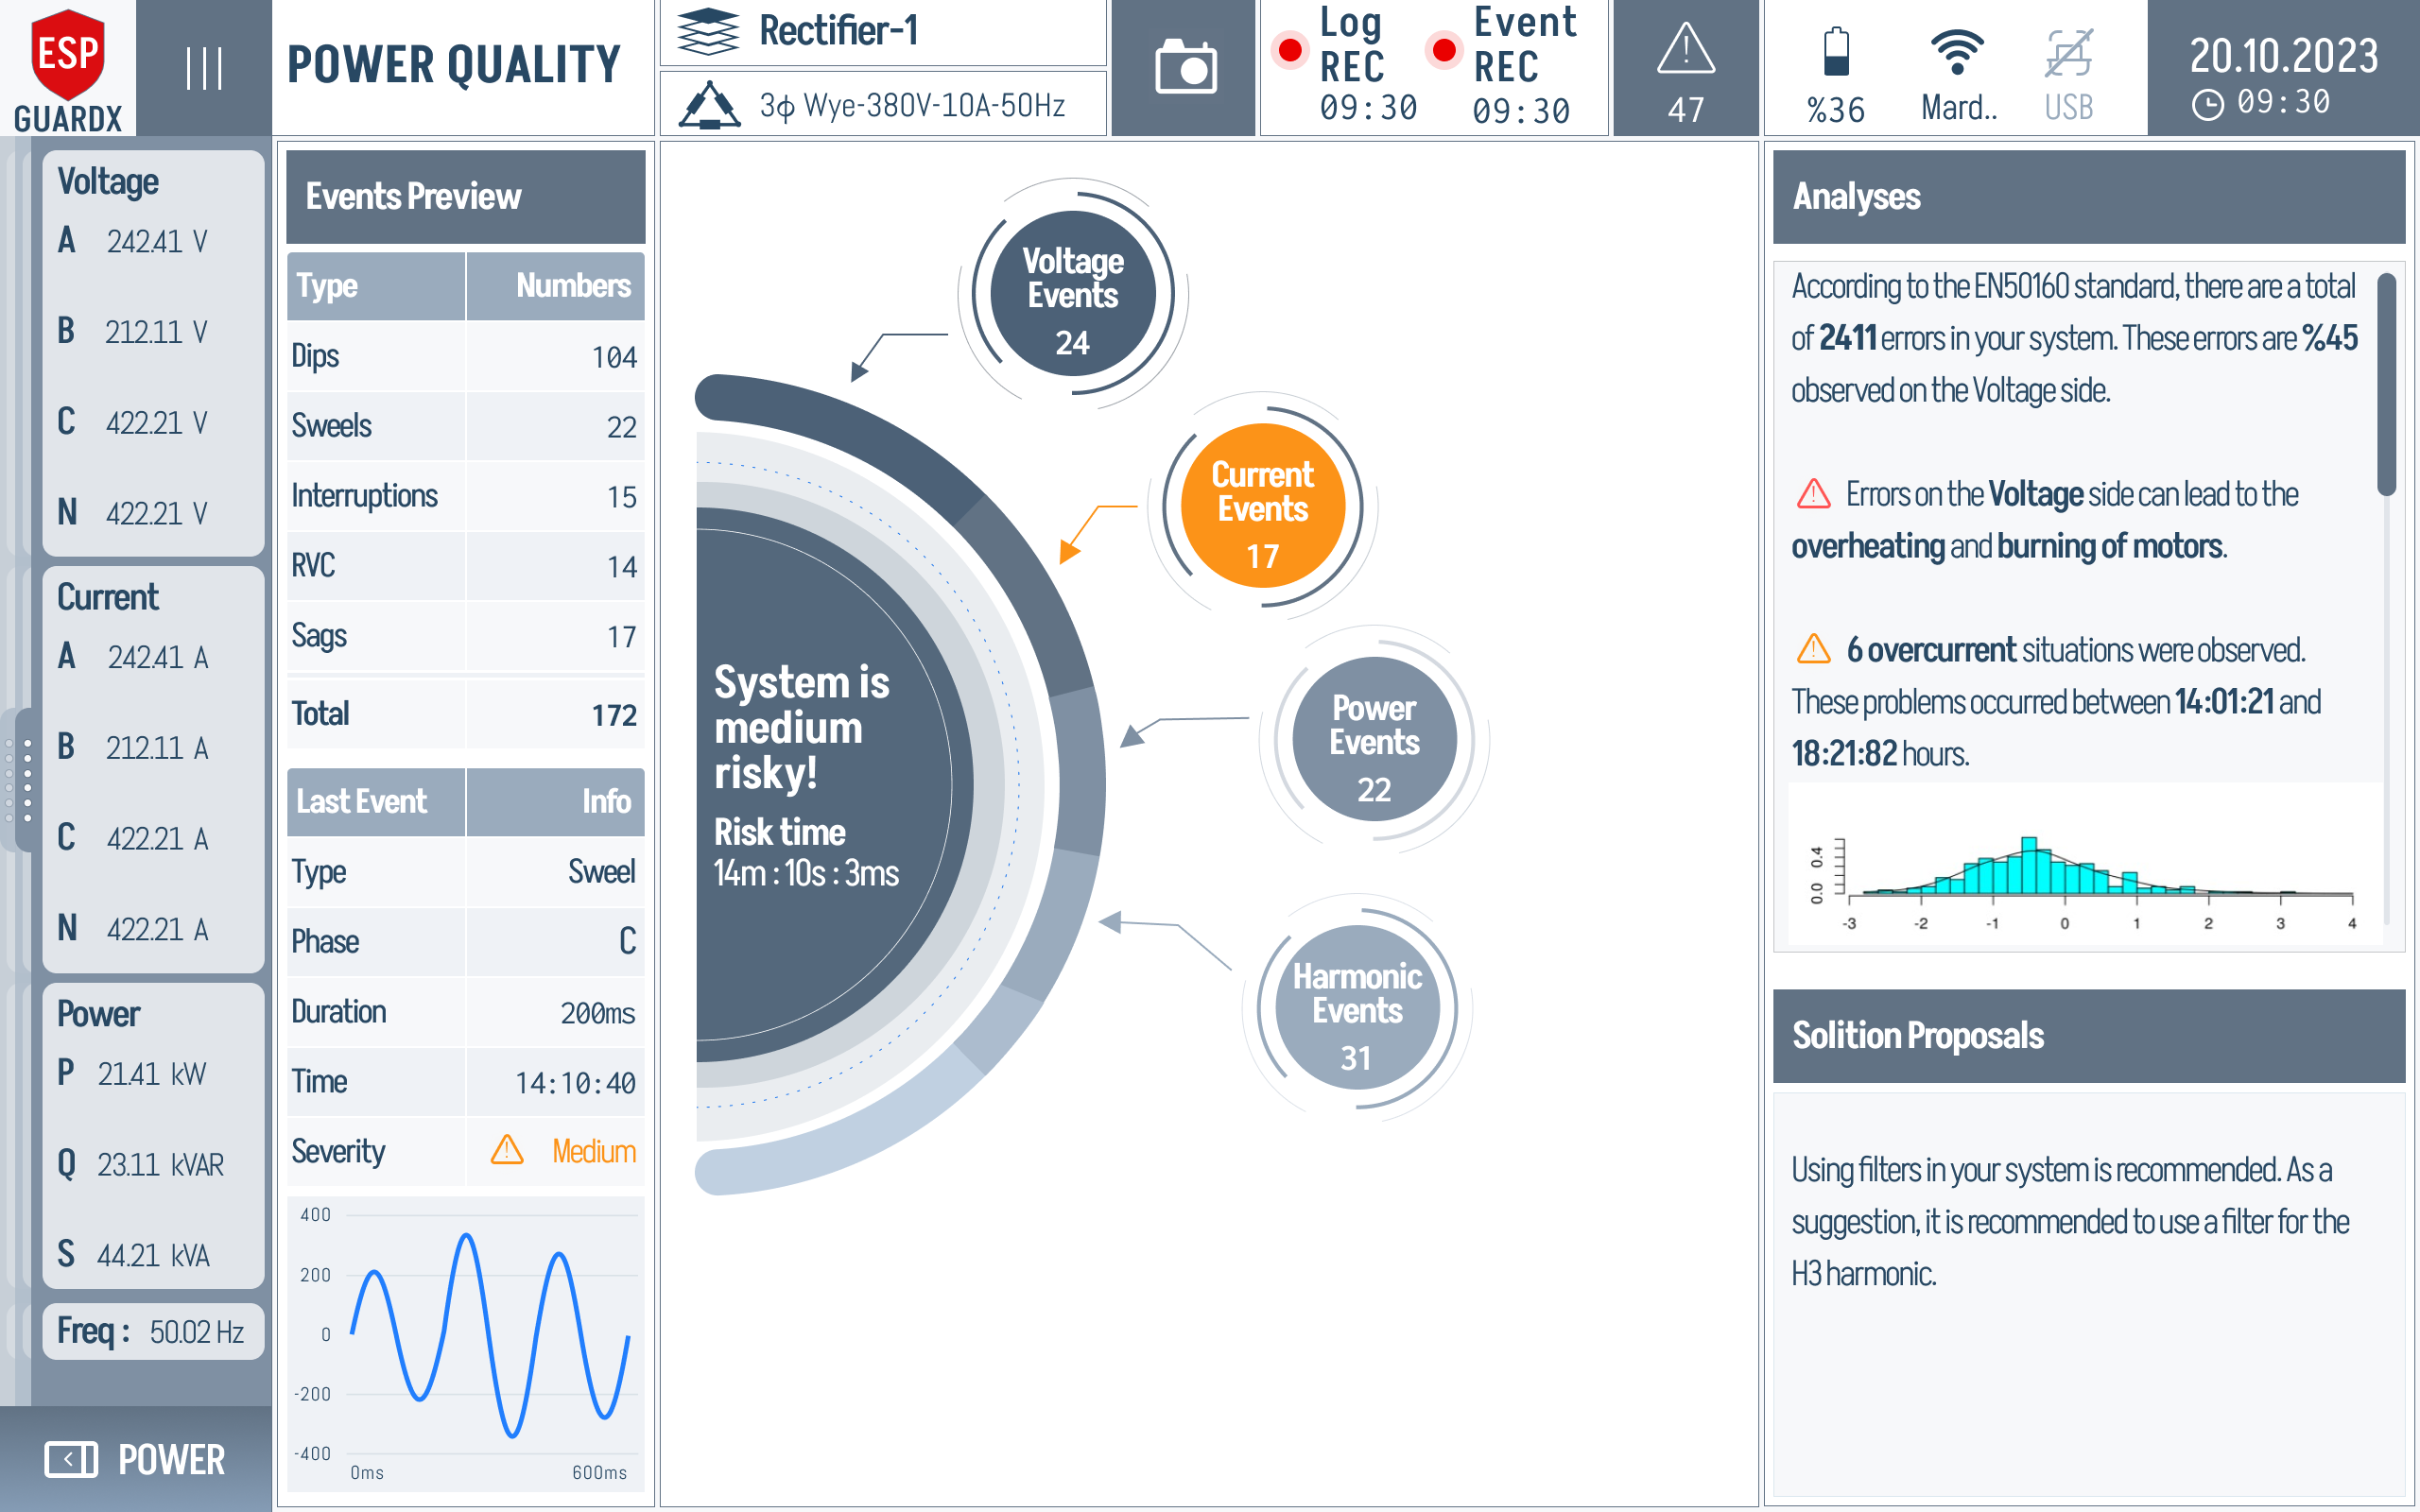
Far-left strip (V / I / Power readouts) — the always-visible side panel that mirrors the basic Status readings (per-phase voltages, currents, active / reactive / apparent power) so you can correlate raw values with what the rest of the screen is alarming on.
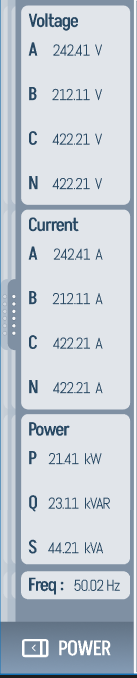
Events Preview (top of left column) — running count by type: Dips, Swells, Interruptions, RVC (Rapid Voltage Changes), Sags, Total.
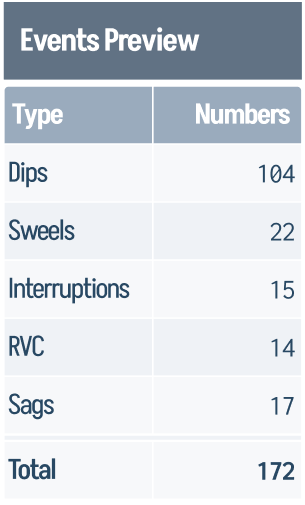
Last Event (bottom of left column) — detail card for the most recent event — Type, Phase, Duration, Time, Severity, plus a small waveform thumbnail.
Risk Ring + Score (centre) — the four-segment ring (Voltage / Current / Power / Harmonic Events) with the headline "System is medium risky! Risk Time …" call-out at its centre.

Analyses (top right) — plain-language interpretation of the EN50160 counts (e.g. "there are 2471 errors in your system, ~45% on the voltage side, leading to overheating and burning of motors").
Solution Proposals (bottom right) — prescriptive recommendations (e.g. "Use filters in your system. As a suggestion, use a filter for the H3 harmonic.").
The bottom-left corner has a POWER shortcut button that returns to the basic Power Measurements screen.

Risk Score and Breakdown Ring
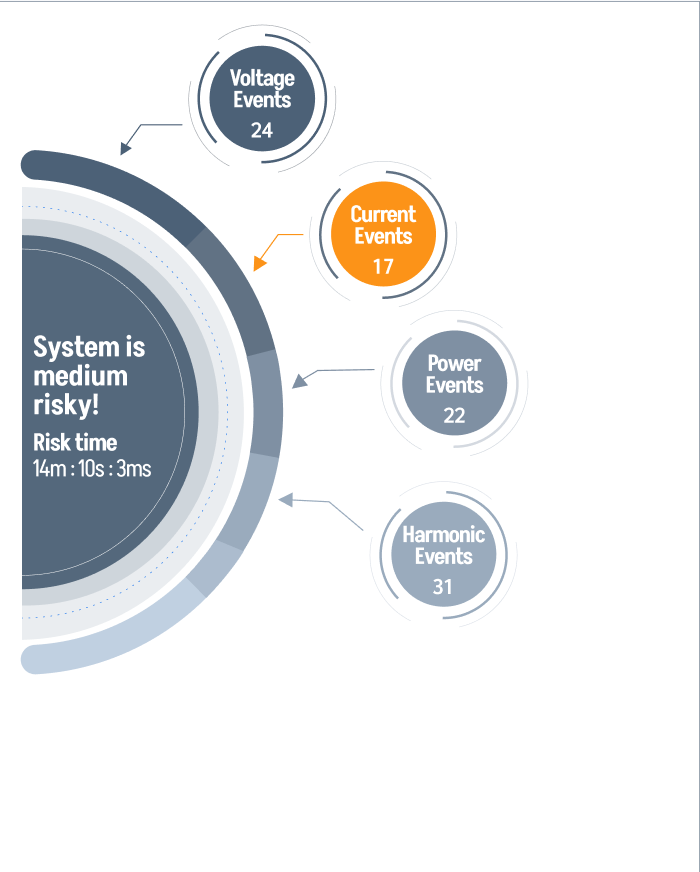
The four ring segments correspond to the four event categories tracked by the device. The headline label inside the ring ("System is medium risky!") is the worst-case across the four — so even if three of them are clean, a single category in the red will drive the overall verdict.
The Risk Time below the headline is the cumulative duration the system has been in the medium-or-worse state in the current EN50160 window — useful when reporting power-quality compliance back to the utility.
Why It Matters
The Analyses and Solution Proposals panels exist because raw event counts are not actionable on their own — "2471 voltage errors" doesn't tell an operator what to do. The analysis maps those counts to motor consequences (overheating, insulation aging) and the proposals point at concrete mitigations (harmonic filters, tap changes, capacitor banks). Treat them as a starting point for a power-quality audit, not as device commands.
Harmonic Distortion
Total Harmonic Distortion (THD)
THD measures how much the voltage or current waveform deviates from a pure sine wave. ESP-GUARDX displays:
- Voltage THD (%) -- Per-phase and average
- Current THD (%) -- Per-phase and average
- Current TDD (%) -- Total Demand Distortion, referenced to full-load current
High THD values indicate the presence of harmonic-producing loads (such as VFDs) and can cause:
- Increased motor heating
- Reduced motor efficiency
- Interference with protection relays
- Increased cable losses
Harmonic Spectrum
The detailed harmonic analysis is available on the dedicated Harmonics screen (see Harmonics Analysis).
For transformer-side comparisons, ESP-GUARDX can also estimate high-voltage harmonic behavior at the Point of Common Coupling (PCC) from synchronized secondary-side measurements. See PCC Estimation for how the reconstructed HV/LV comparison works.
Phase Unbalance
Phase unbalance occurs when the three-phase voltages or currents are not equal in magnitude or are not 120 degrees apart. The Power Quality screen displays:
- Voltage Unbalance (%) -- Indicates supply-side issues
- Current Unbalance (%) -- Can indicate motor winding problems
Unbalance Limits
| Condition | Typical Limit |
|---|---|
| Normal | < 1% voltage unbalance |
| Warning | 2--3% voltage unbalance |
| Critical | > 5% voltage unbalance |
Important
Even a 3.5% voltage unbalance can cause a 25% increase in motor temperature rise, significantly reducing motor life.
Power Quality Events
The Power Quality screen tracks and counts the following event types:
| Event Type | Description |
|---|---|
| Voltage Dips | Brief reductions in voltage below normal |
| Voltage Swells | Brief increases in voltage above normal |
| Interruptions | Complete loss of voltage |
| RVC (Rapid Voltage Changes) | Sudden voltage transitions |
| Transients | Very fast voltage spikes (lightning, switching) |
Each event type shows a running count and can trigger automatic event recording when thresholds are exceeded.
IEC 61000-4-30 Compliance
ESP-GUARDX harmonic measurements follow the IEC 61000-4-30 standard:
- Gapless window analysis
- 5th harmonic RMS buffering
- Equation 2 calculations for harmonic assessment
- Pass/fail harmonic testing against standard limits