System Diagrams
Three views of how ESP-GUARDX is put together. The first shows the physical hardware layout inside the device — the two enclosures, the boards inside each, and the external devices that connect to them. The second is a functional block diagram of the major modules and the signal paths between them. The third walks through the signal acquisition flow from the field to the live display and event recording.
Hardware Block Diagram
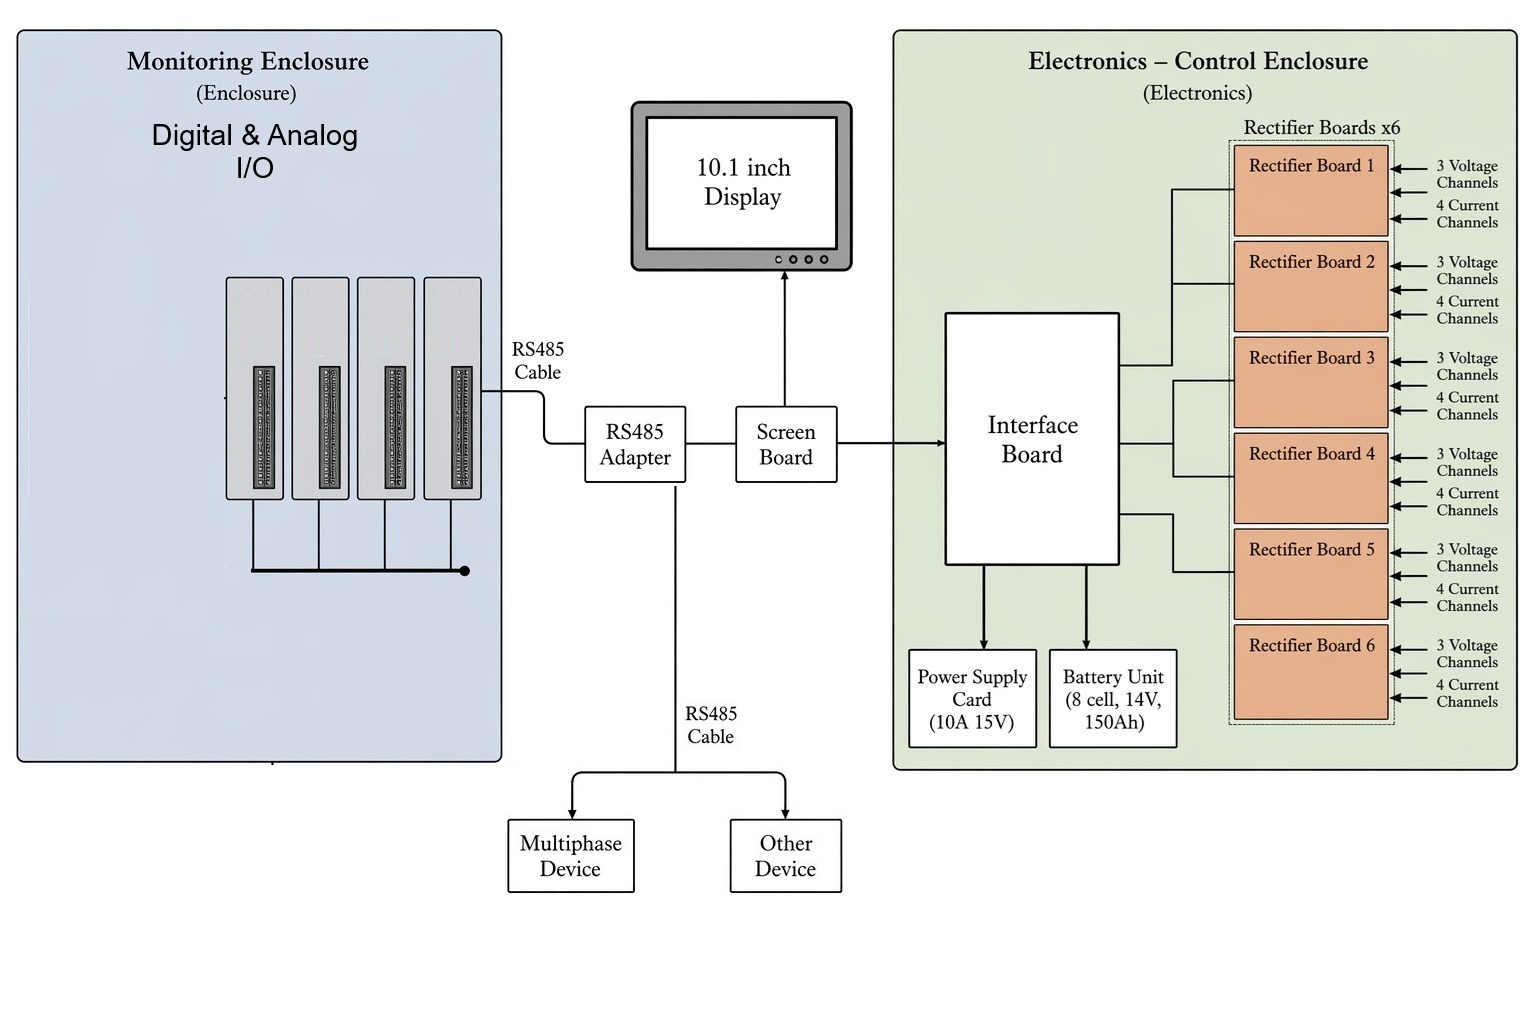
The device is split into two enclosures connected by an RS485 link:
- Monitoring Enclosure houses four Digital & Analog I/O modules. These accept the auxiliary sensor lines (downhole, wellhead, flow, vibration) and the digital status / control I/O.
- Electronics – Control Enclosure houses the Interface Board, the Power Supply Card (10 A, 15 V), the Battery Unit (8-cell, 14 V, 150 Ah backup) and six Rectifier Boards. Each rectifier board carries 3 voltage channels and 4 current channels, giving the device a total of 18 voltage channels and 24 current channels for three-phase plus auxiliary measurements.
- The Screen Board drives the 10.1″ touchscreen display through the RS485 Adapter, which is also the bridge to the Monitoring Enclosure and to external Multiphase / other Modbus devices.
This layout is what the rest of the manual is implicitly describing: the I/O screens map onto the Monitoring Enclosure side, the power and waveform screens map onto the Rectifier Boards on the Electronics side, and the Communication screens map onto the RS485 cabling shown here.
System Block Diagram
flowchart LR
    subgraph Inputs["Field Inputs"]
        direction TB
        V[Voltage Transformers<br/>3-phase]
        C[Current Transformers /<br/>Rogowski Coils]
        S[Downhole & Wellhead<br/>Sensors]
        P[PLC / External<br/>Modbus Devices]
    end

    subgraph Dev["ESP-GUARDX Device"]
        direction TB
        subgraph Mon["Monitoring Enclosure"]
            IO[Digital & Analog I/O<br/>4 modules]
        end
        subgraph Elec["Electronics – Control Enclosure"]
            direction TB
            REC[6 Rectifier Boards<br/>18 V + 24 I channels]
            INT[Interface Board<br/>Processing & Analytics]
            BAT[Battery Unit<br/>8-cell 14V 150Ah]
            PSU[Power Supply<br/>10A 15V]
        end
        SCR[Screen Board ↔<br/>10.1″ Touchscreen]
        ADP[RS485 Adapter]
    end

    subgraph Out["Connectivity & Output"]
        direction TB
        R[RS-485<br/>Modbus RTU]
        U[USB / SD Card<br/>Export]
    end

    V --> REC
    C --> REC
    REC --> INT
    S --> IO --> ADP
    ADP --> INT
    P <--> ADP
    INT --> SCR
    PSU --> INT
    BAT --> INT
    INT --> R
INT --> U- Voltage and current signals from the switchgear pass through transformers into the Rectifier Boards for digitization (six boards, 18 voltage + 24 current channels).
- Downhole, wellhead, and flow sensors terminate on the Digital & Analog I/O modules in the Monitoring Enclosure and reach the Interface Board over the RS485 Adapter.
- External PLCs and Modbus devices exchange data with the Interface Board over the same RS485 bus.
- The Interface Board runs signal analysis, event detection, and optimization, and pushes the result to the Screen Board for the 10.1″ touchscreen.
- The Power Supply Card (10 A, 15 V) and the 8-cell, 14 V, 150 Ah battery keep the Interface Board running through power events.
- Connectivity is provided via RS-485 (Modbus RTU) for industrial integration, and USB / SD card for data export.
Signal Acquisition Flow
flowchart LR
    subgraph Field["Field / Switchgear"]
        direction TB
        MV[Motor Voltage<br/>3-phase]
        MC[Motor Current<br/>3-phase]
    end

    VTs[Voltage Transformers<br/>step-down]
    CTs[Current Transformers /<br/>Rogowski Coils]

    subgraph Front["Front-End"]
        direction TB
        Cond[Signal Conditioning]
        ADC[High-speed ADC]
    end

    subgraph Proc["Processing"]
        direction TB
        DSP[RMS, Phasors,<br/>Power Calculations]
        Harm[Harmonic<br/>Decomposition]
        Evt[Threshold &<br/>Event Engine]
    end

    MV --> VTs --> Cond
    MC --> CTs --> Cond
    Cond --> ADC
    ADC --> DSP
    DSP --> Harm
    DSP --> Evt
    Harm --> Evt
    DSP --> Live[Live Display<br/>& Oscilloscope]
    Evt --> Rec[Event Recording<br/>Pre- & Post-trigger]
Voltage and current from the switchgear are reduced by transformers, conditioned, and digitized at high speed. The processor then runs RMS, phasor, and power calculations in parallel with harmonic decomposition, and continuously compares results against configured thresholds to detect events.