Main Settings
The Main Settings screen allows you to configure the fundamental electrical parameters of the monitored system. Access it from Settings > Main Settings.
Configuration Parameters
Connection Topology
Select the type of electrical connection:
| Option | Description |
|---|---|
| 3-Phase | Standard three-phase ESP motor connection (most common) |
| 1-Phase | Single-phase equipment monitoring |
Nominal Voltage
The rated voltage of the system in Volts. This is the reference value used for:
- Percentage-based event thresholds (e.g., "10% under voltage" means 10% below this value)
- Voltage unbalance calculations
- Motor load calculations
Typical values:
- ESP motors: 1,000--4,000 V (commonly 1,950 V)
- Surface equipment: 380--480 V
VT Ratio
The Voltage Transformer ratio. This converts the measured secondary voltage back to the actual primary (system) voltage.
Example: If your VT steps down 1,950 V to 110 V, the VT ratio is 1950/110 = 17.73
Nominal Current
The rated current of the system in Amperes. This is the reference for:
- Overcurrent and undercurrent thresholds
- Motor load percentage calculation
- Current unbalance calculations
CT Ratio
The Current Transformer ratio. This converts the measured secondary current back to the actual primary current.
Example: If your CT steps down 100 A to 5 A, the CT ratio is 100/5 = 20
Clamp Type
The type of current measurement device:
- Standard CT (Current Transformer)
- Rogowski coil
- Hall-effect sensor
Frequency
The nominal system frequency in Hz. Set this to your system's rated base frequency (typically 50 or 60 Hz) — it is used as the reference for:
- Frequency deviation event thresholds
- Harmonic frequency calculations
- Motor speed calculations
Supported VFD operating range
ESP-GUARDX supports VFD output frequencies from 30 Hz to 400 Hz. The Frequency field here is the nominal reference value, not the live VFD output.
Saving Settings
After changing any setting, tap Save to apply the changes. Settings are stored in a configuration file and persist across reboots.
Important
Changing the nominal voltage, current, or CT/VT ratios will affect all percentage-based calculations and event thresholds. Verify that event thresholds are still appropriate after changing these values.
Performance Logger Settings
The ESP Performance Settings screen configures the long-term data logger that feeds the Performance Data Viewer. Each category (Pump, Motor, Well, Power) exposes its own set of logger types, and you pick which parameters get recorded, how often, and where.
Common controls across every tab:
| Control | Description |
|---|---|
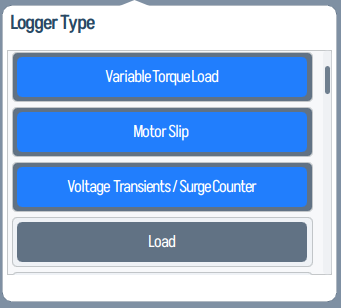
| Logger Type | Which parameters to record for the selected category |
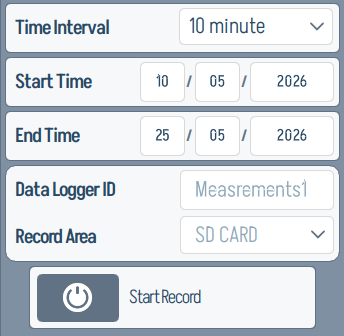
| Time Interval | Sample rate (e.g., 1 second, 10 seconds, 1 minute) |
| Start Time / End Time | Bounded window, or run continuously |
| Data Logger ID | Label used to identify the recording in the viewer |
| Record Area | SD Card, Internal Memory, or USB |
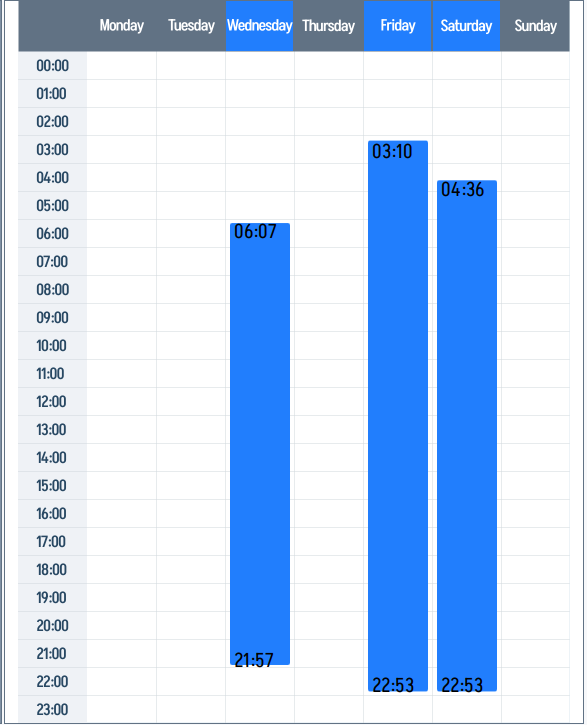
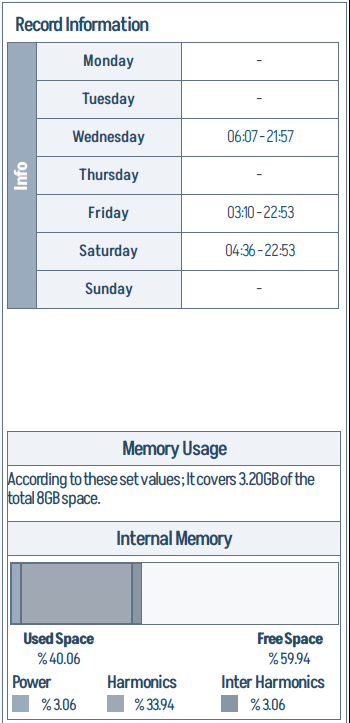
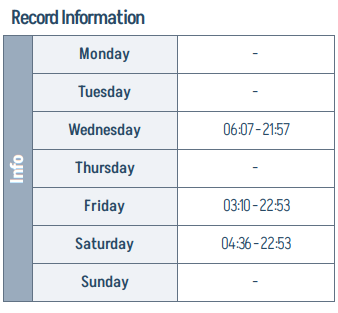
| Record Information | Per-day start/end times to apply the logger on a weekly schedule |
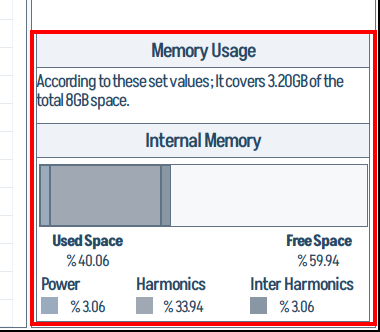
| Memory Usage | Estimated footprint vs. free space, broken down by Power / Harmonics / Inter-Harmonics |
Tab selectors at the top switch the panel to one of the four logger categories — Pump / Motor / Well / Power.
Pump Logger
Speed, TDH, Intake Pressure, Discharge Pressure, Differential Pressure, Specific Gravity, Flow Rate, Efficiency, Power, Head.
The Pump tab indicator on the top tab row:
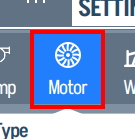
Motor Logger
Torque, Constant Torque Load, Variable Torque Load, Motor Slip, and related motor signals.
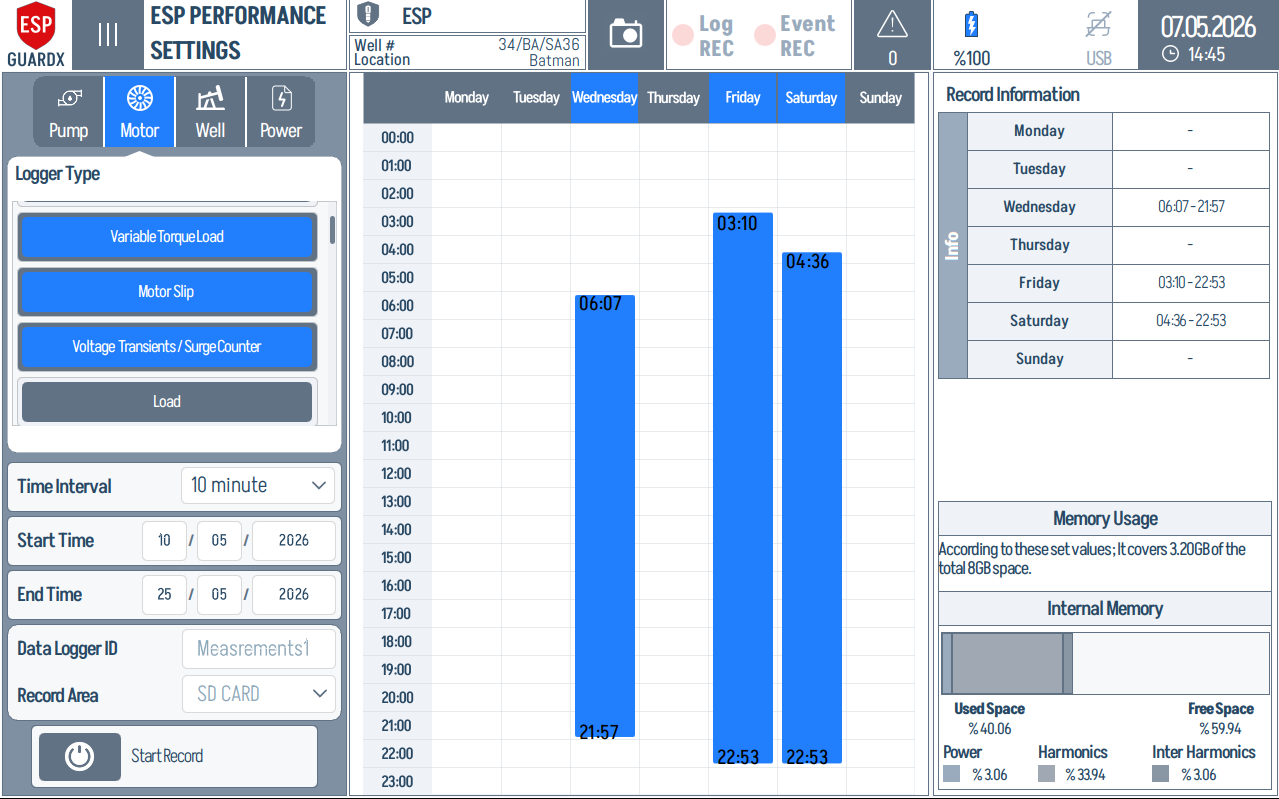
Each tab shares the same three-column layout. Using the Motor tab as the example:
Left column — Logger Type list and acquisition controls.
Centre column — weekly calendar grid that maps the 7-day × 24-hour Record Information matrix.
Right column — Record Information per day, Memory Usage estimate, and the Internal Memory breakdown by Power / Harmonics / Inter-Harmonics.
Well Logger
Wellhead Pressure (WHP), Wellhead Temperature (WCP), Casing Pressure (WCP), Bottomhole Pressure (BHP).
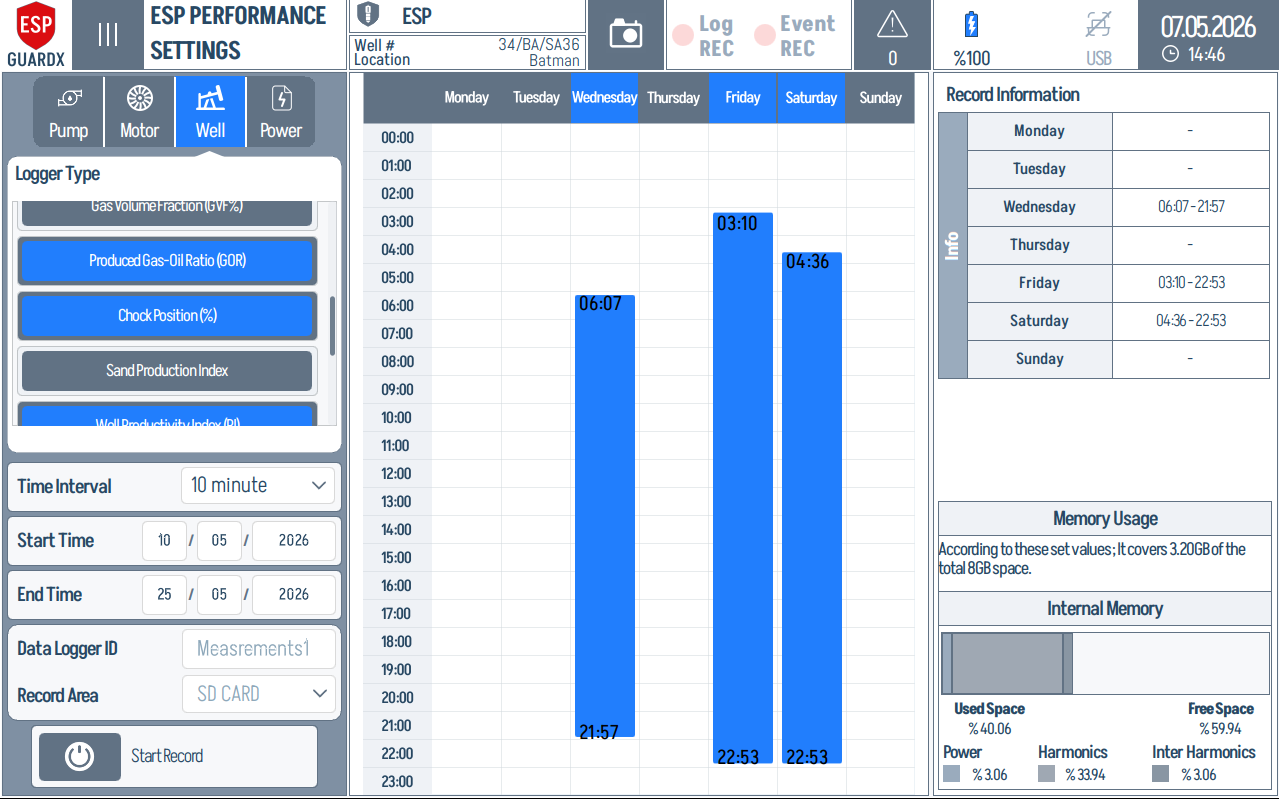
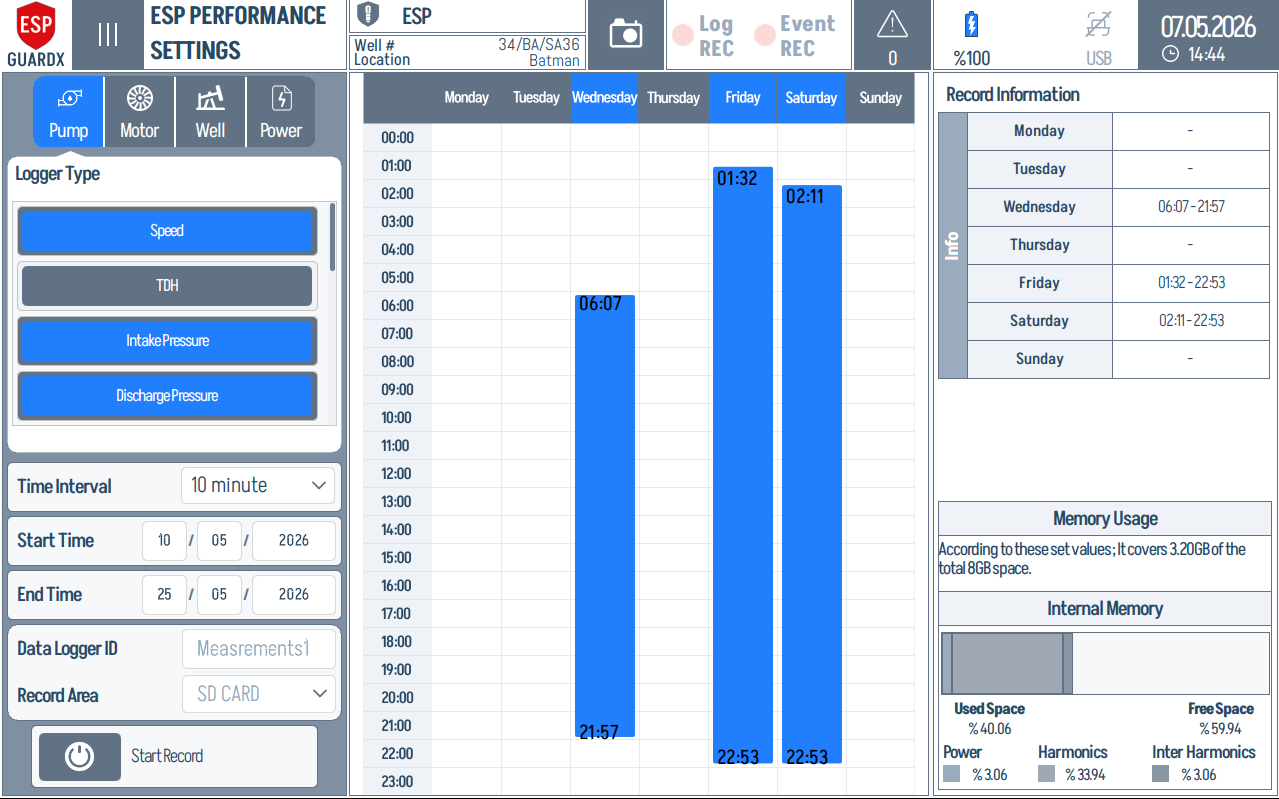
Power Logger
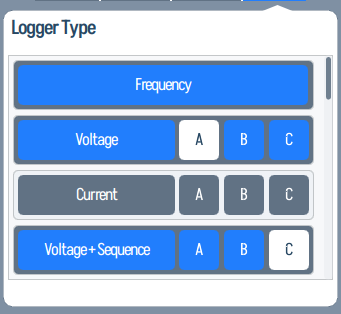
Frequency, per-phase Voltage (A/B/C), per-phase Current (A/B/C), and Voltage + Sequence data.
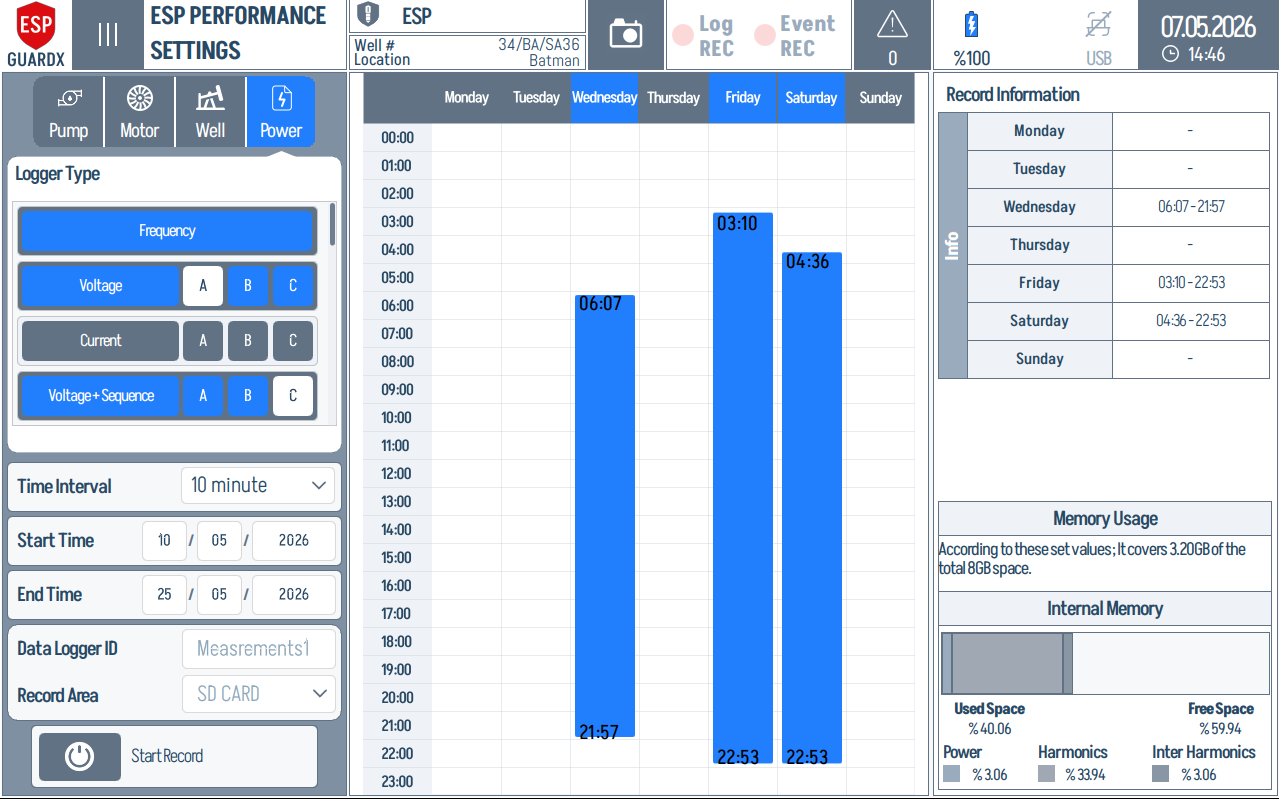
This populated Power logger example shows the schedule after channels and record windows have been selected. The blue calendar blocks mark the active recording periods, while the right column summarizes daily record information and estimated memory use.
The Power tab indicator and left logger list:
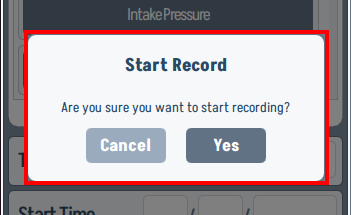
Starting a Recording
Tap Start Record to begin logging. A confirmation dialog prevents accidental starts.
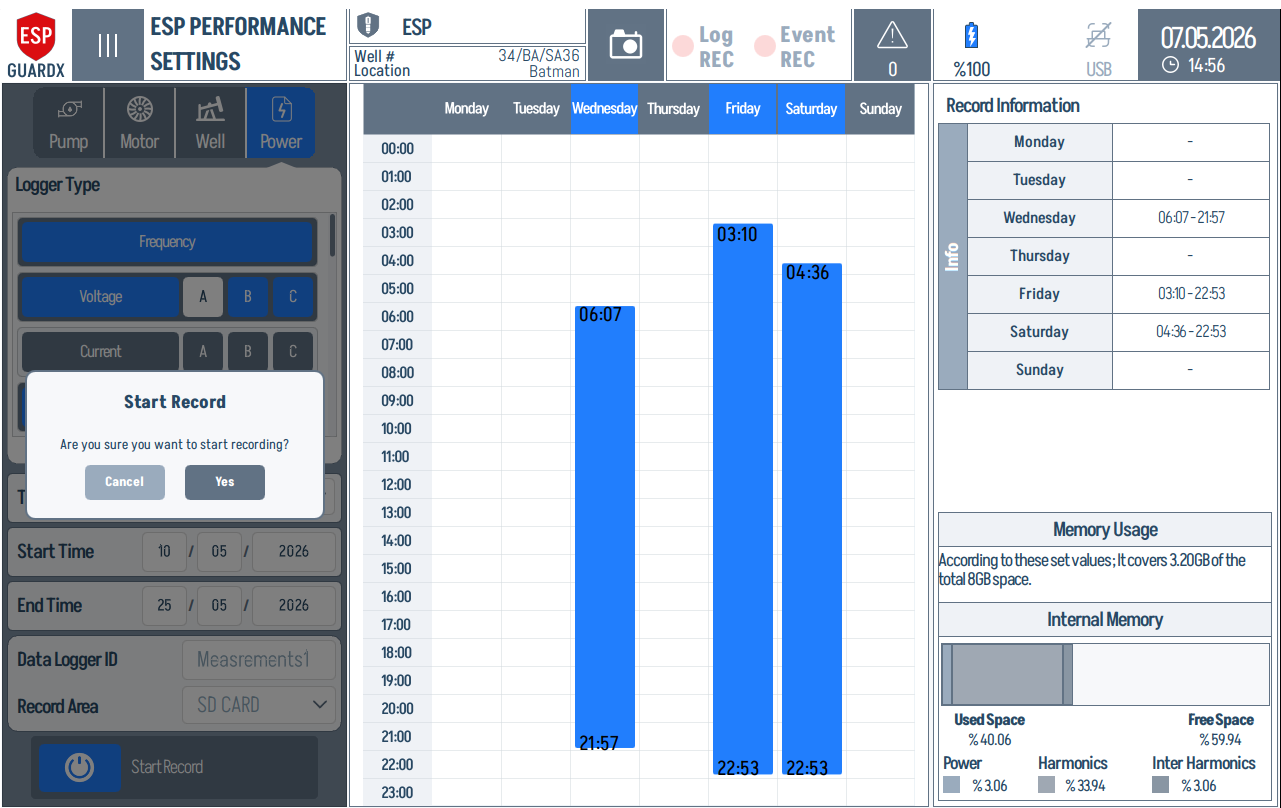
Zoom of the confirmation dialog itself:
I/O Settings
The I/O Settings screen configures the device's digital and analog input/output cards. It is split into two tabs:
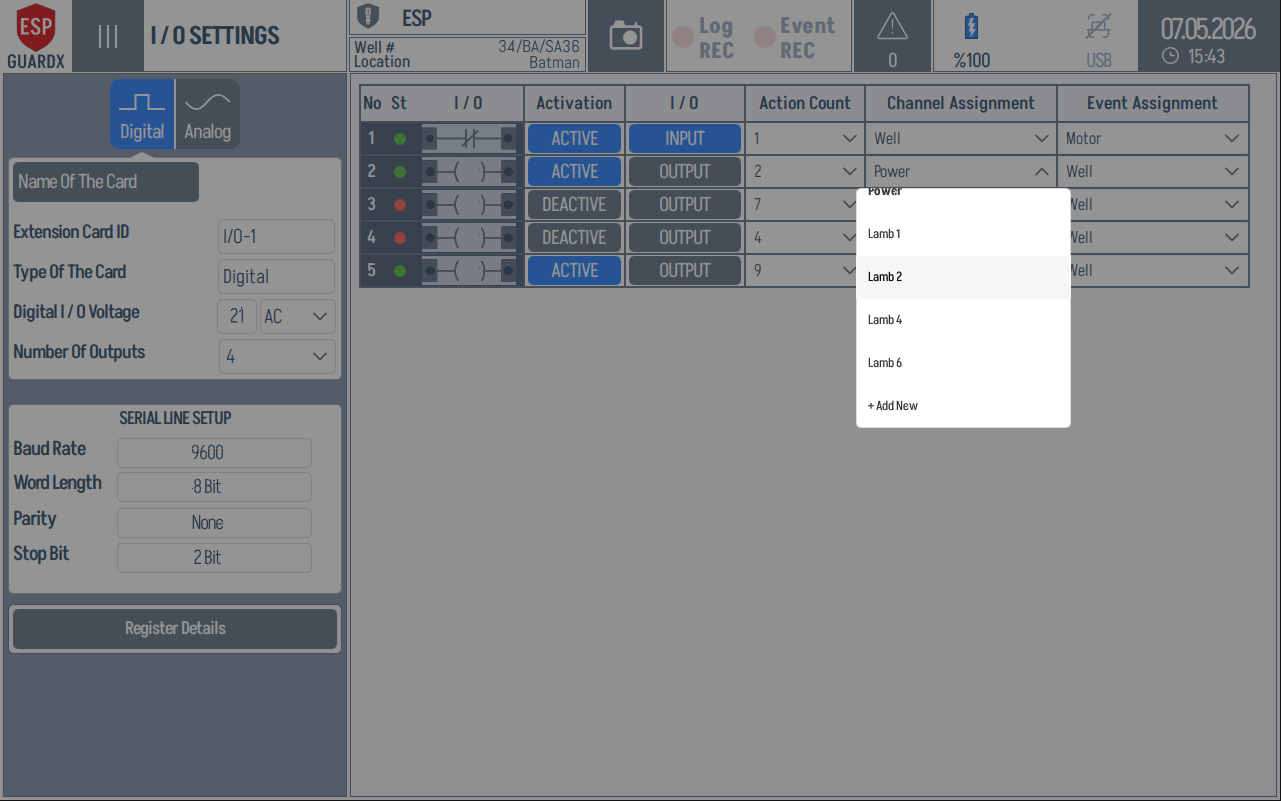
Digital I/O
Each channel row shows its I/O number, Activation state, Contact Setting (NC/NO), Action Count, and Event Assignment (Motor / Pump / Well / Power). The left panel sets card-level properties — Extension Card ID, Card Type, Digital I/O Voltage, Number Of Inputs, and the Modbus Serial Line Setup.
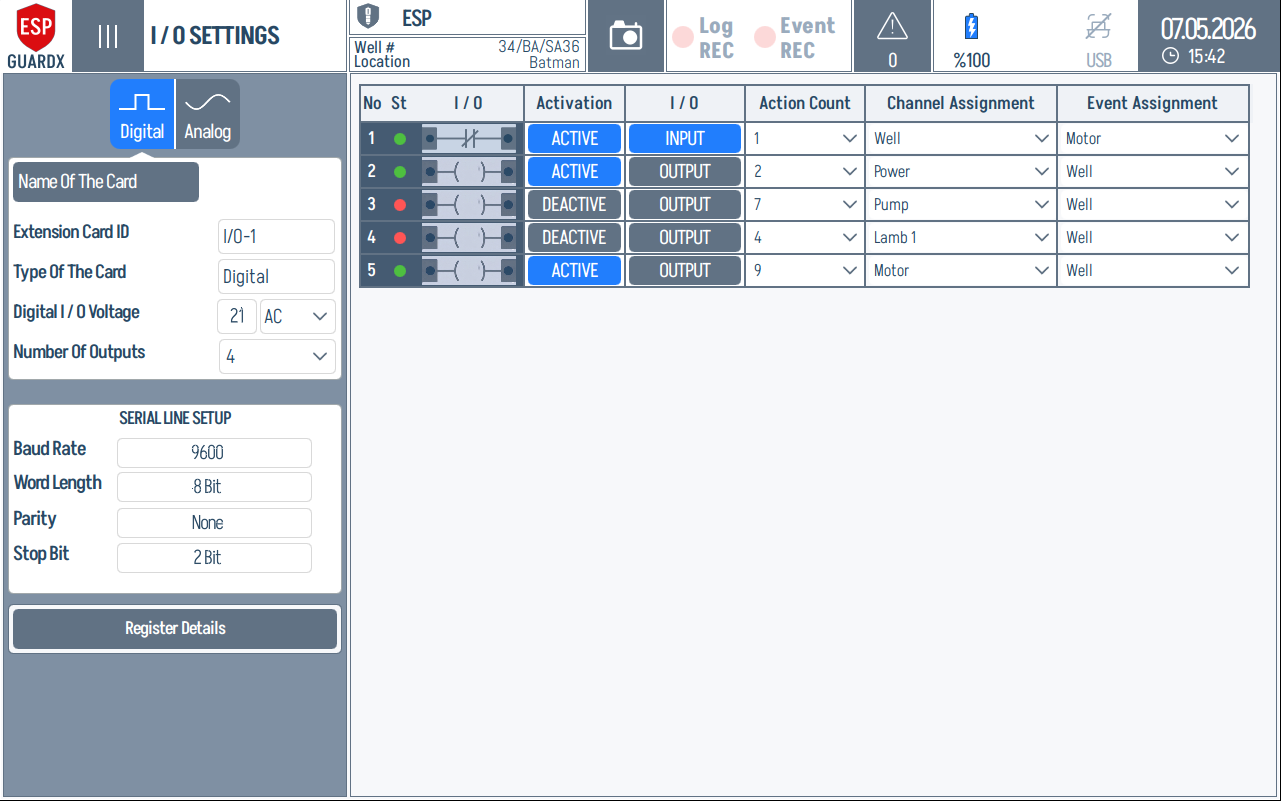
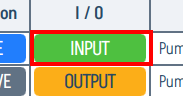
This populated example shows how the digital row is read left-to-right: channel number and status, input/output contact symbol, active/deactive state, NO/NC contact setting, action count, and the event assignment targets for Motor, Pump, Well, or Power.
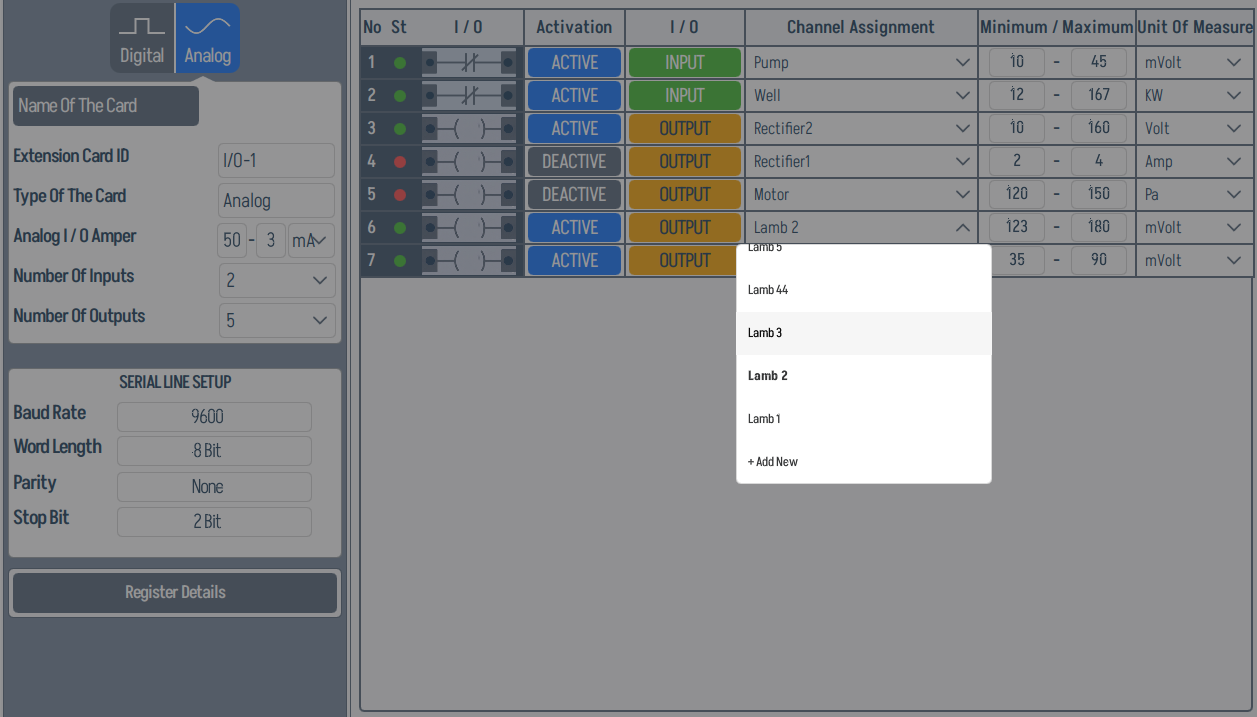
Analog I/O
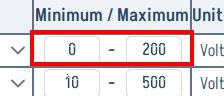
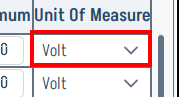
Analog channels add a Channel Assignment (parameter name), minimum / maximum range, and unit of measure. The left panel also exposes the card ID, type, analog I/O amperage, and serial line setup.
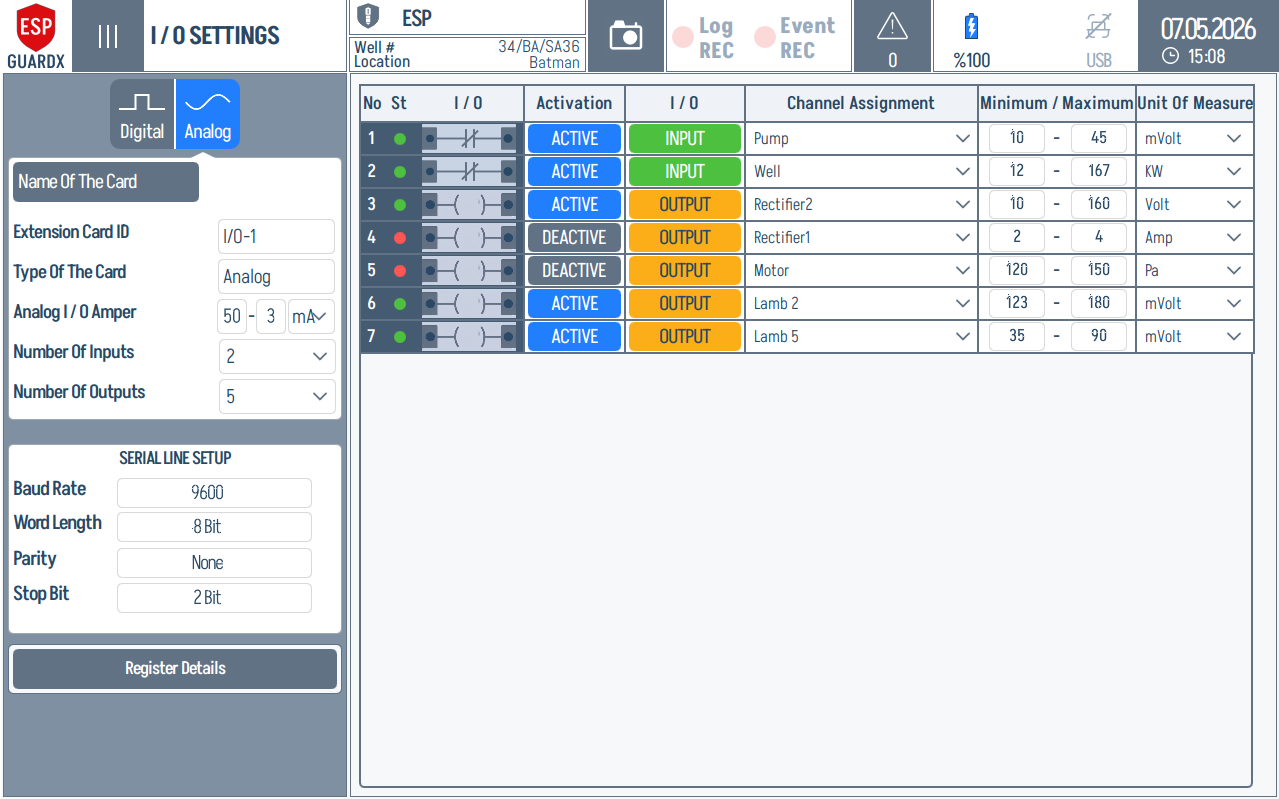
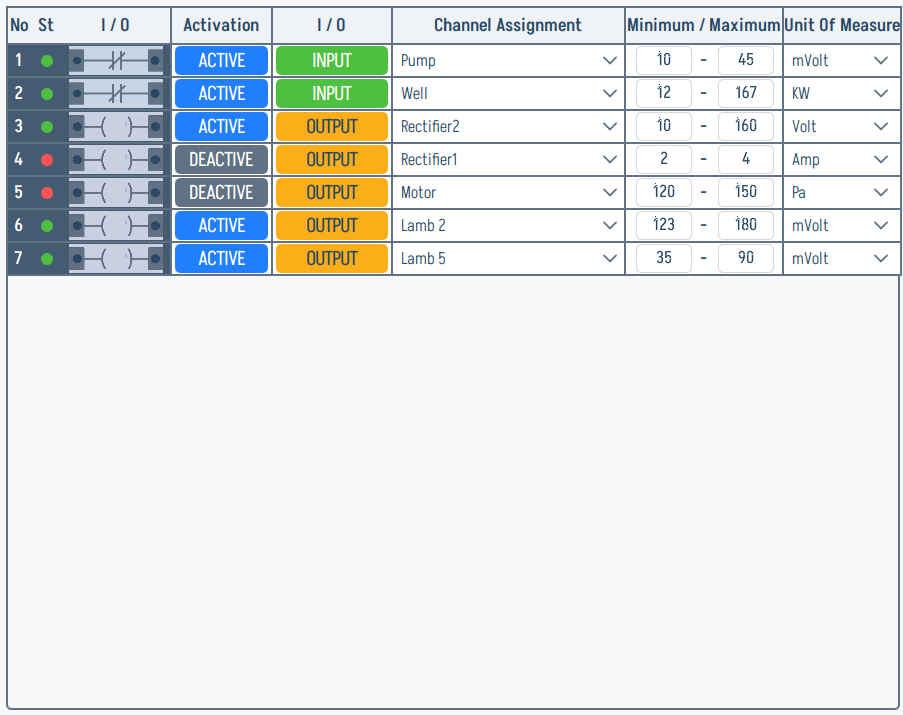
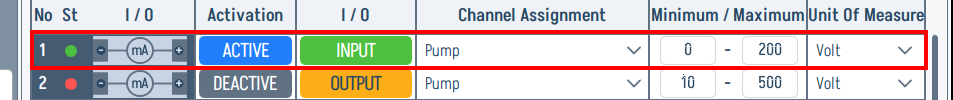
This full Analog I/O example is useful when checking scale and engineering-unit setup: each row ties activation state, input/output direction, channel assignment, minimum/maximum range, and unit of measure to the physical I/O channel.
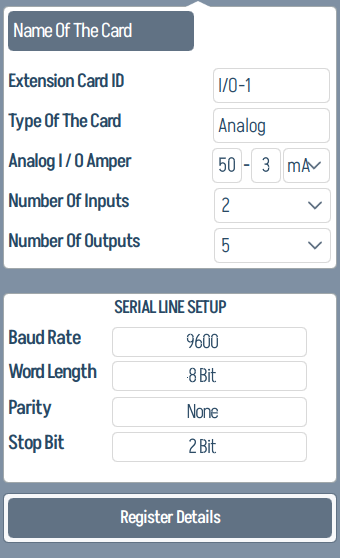
The Analog tab indicator and the per-card left sidebar (Name Of The Card, Extension Card ID, Type, Analog I/O Amper, Number Of Inputs / Outputs, SERIAL LINE SETUP, Assign Device ID, Register Details):
The right channel table breaks into the column headers shown below — read left-to-right: No / I/O activation / I/O direction / Channel Assignment / Min-Max range / Unit Of Measure.
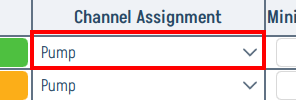
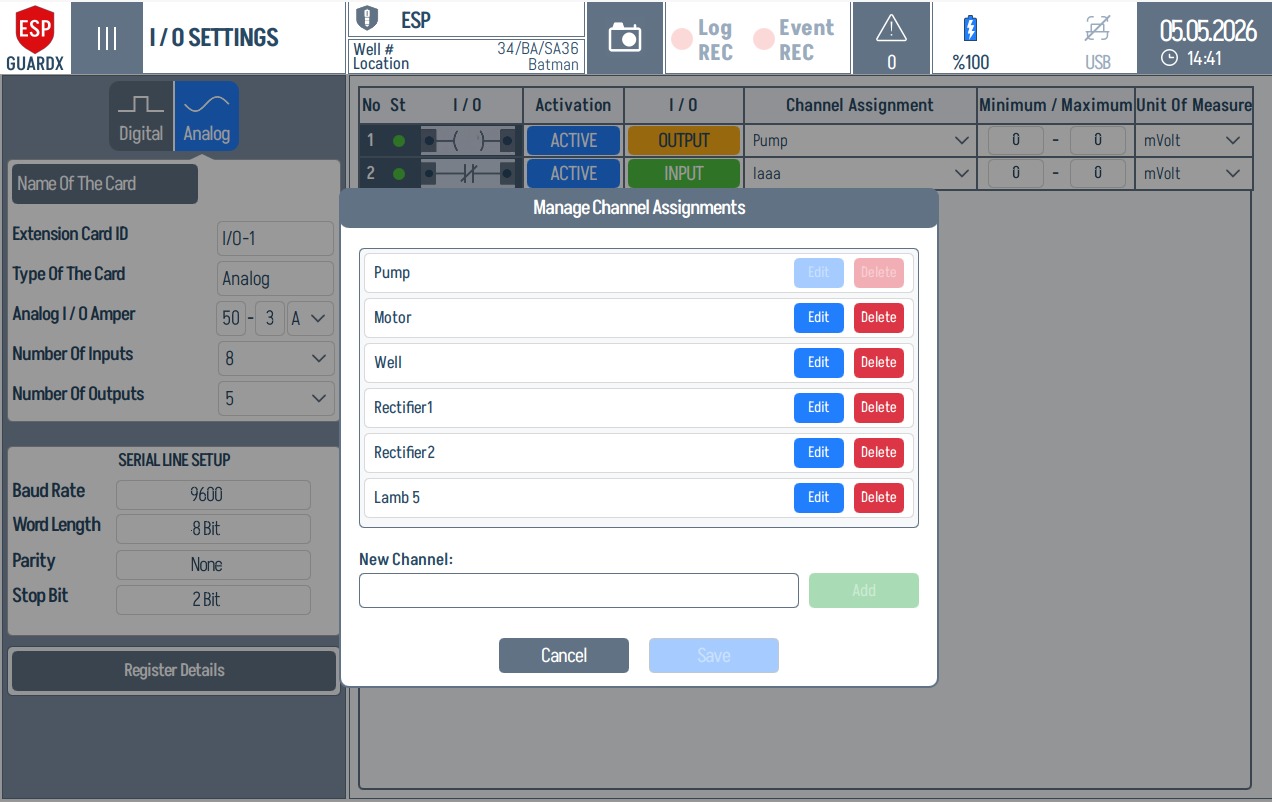
Channel Assignments
The Channel Assignment field ties each physical I/O channel to a named signal such as Pump, Motor, Well, Power, or a site-specific label. The dropdown shows existing assignments and an Add New entry for adding another label.
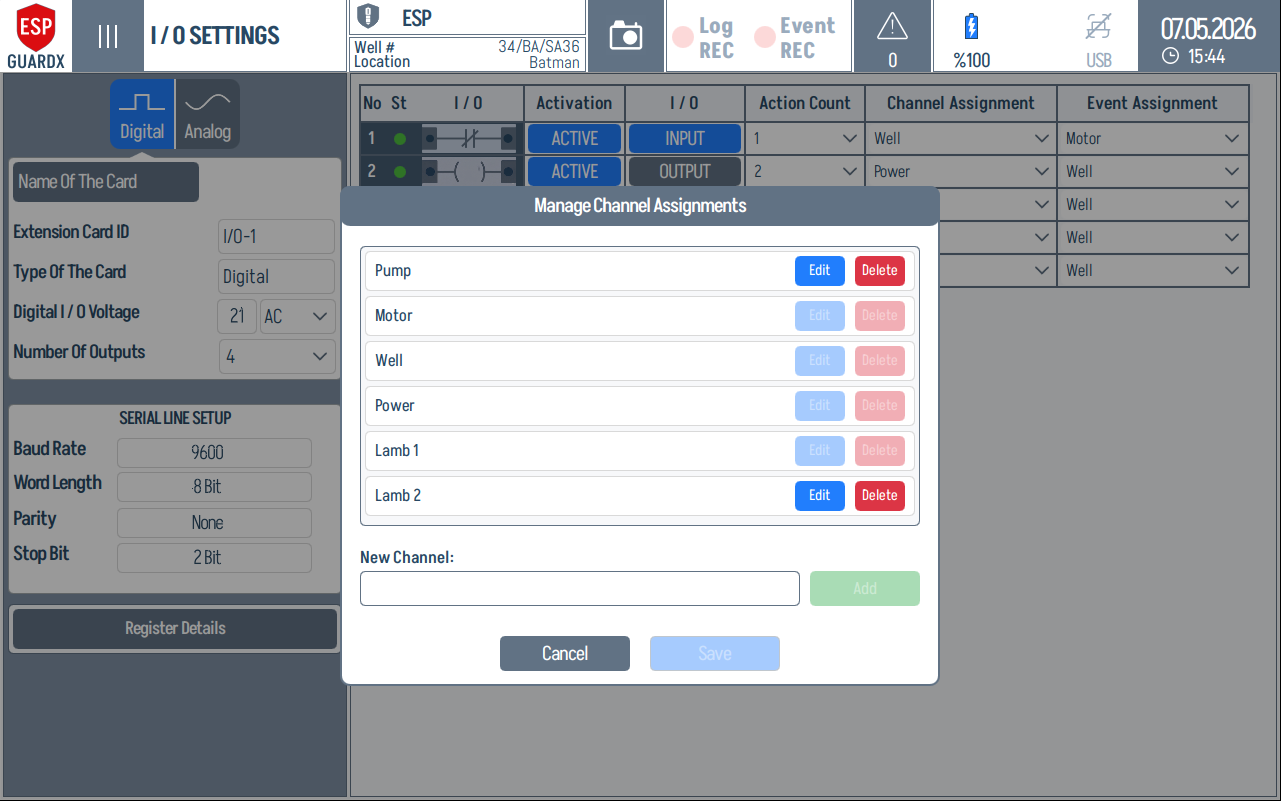
The management dialog is used to edit, delete, add, and save reusable channel-assignment names.
Digital channels use the same assignment workflow, but the row also carries the event assignment used by the event-recording logic.
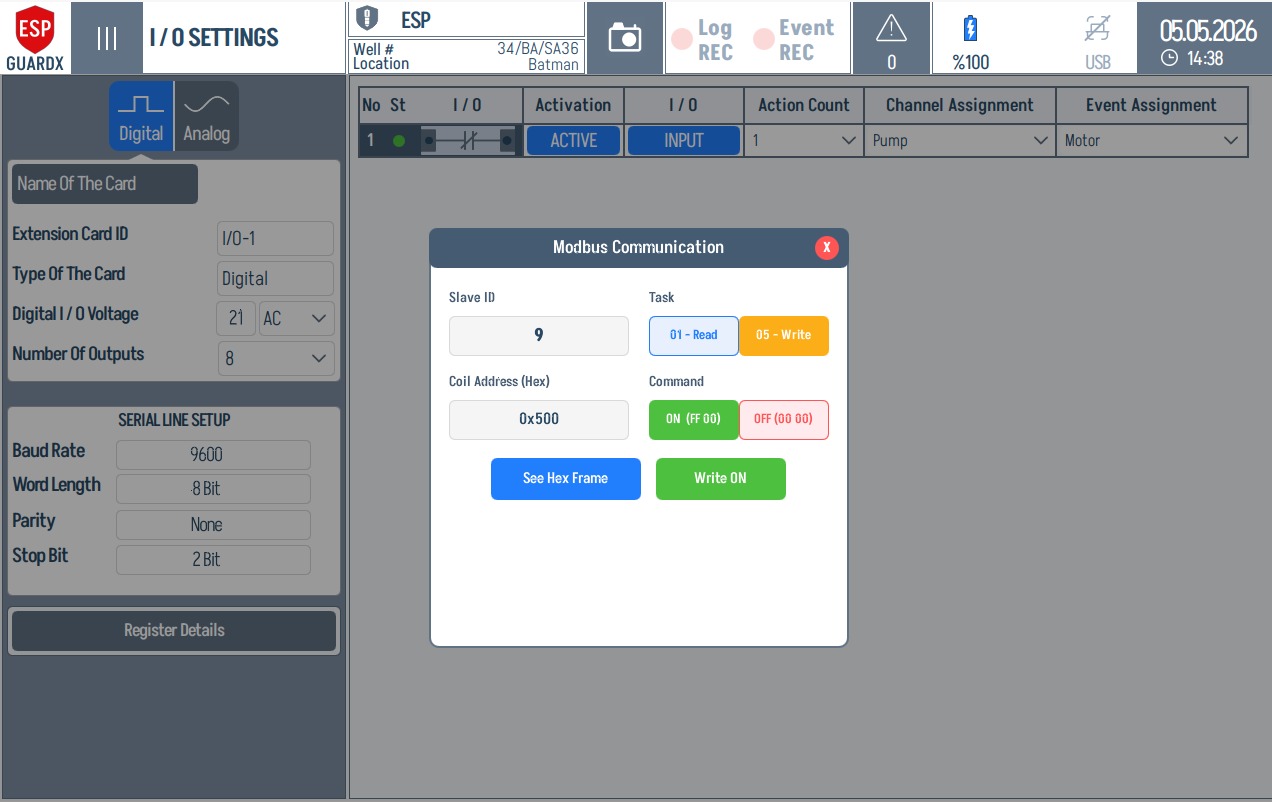
Modbus Communication Test
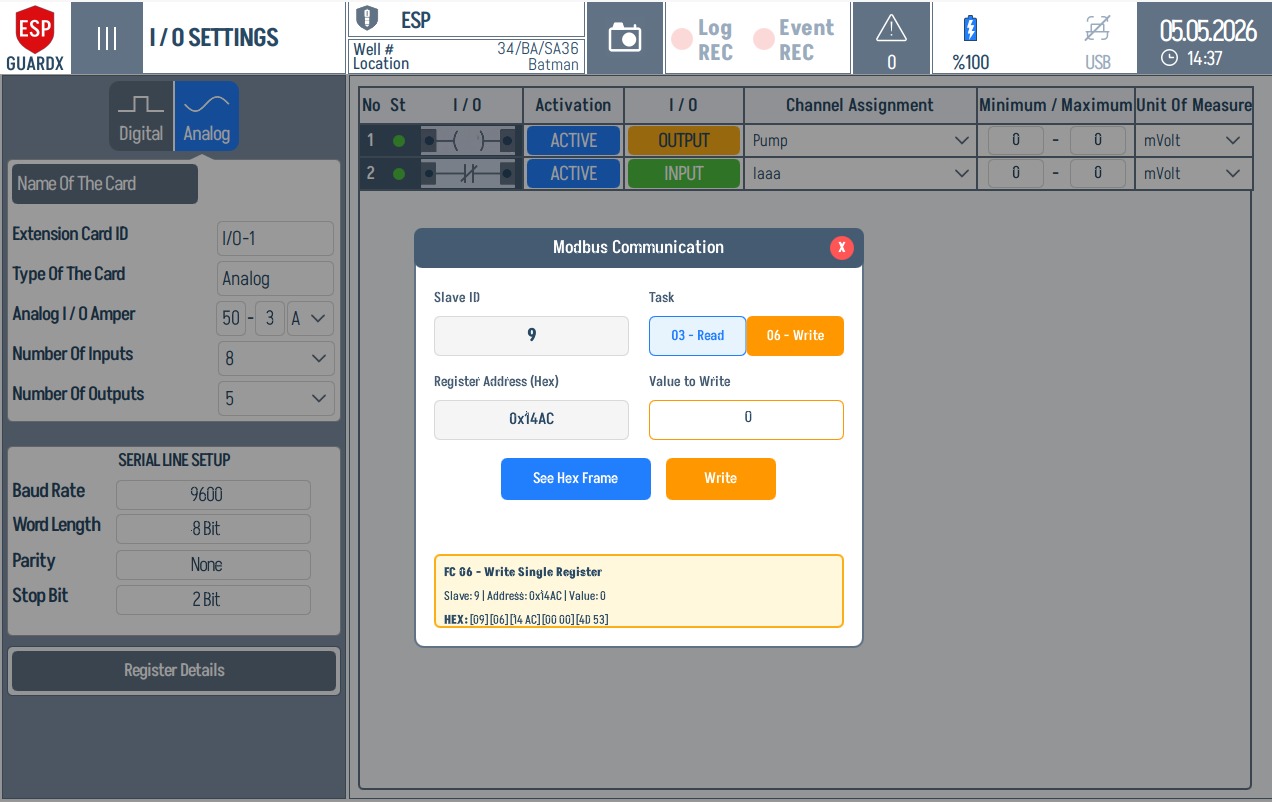
The Register Details / channel tools can open a Modbus communication dialog for checking the exact request that will be sent to an I/O module. Analog channels use register-oriented function codes such as 03 - Read Holding Registers and 06 - Write Single Register.
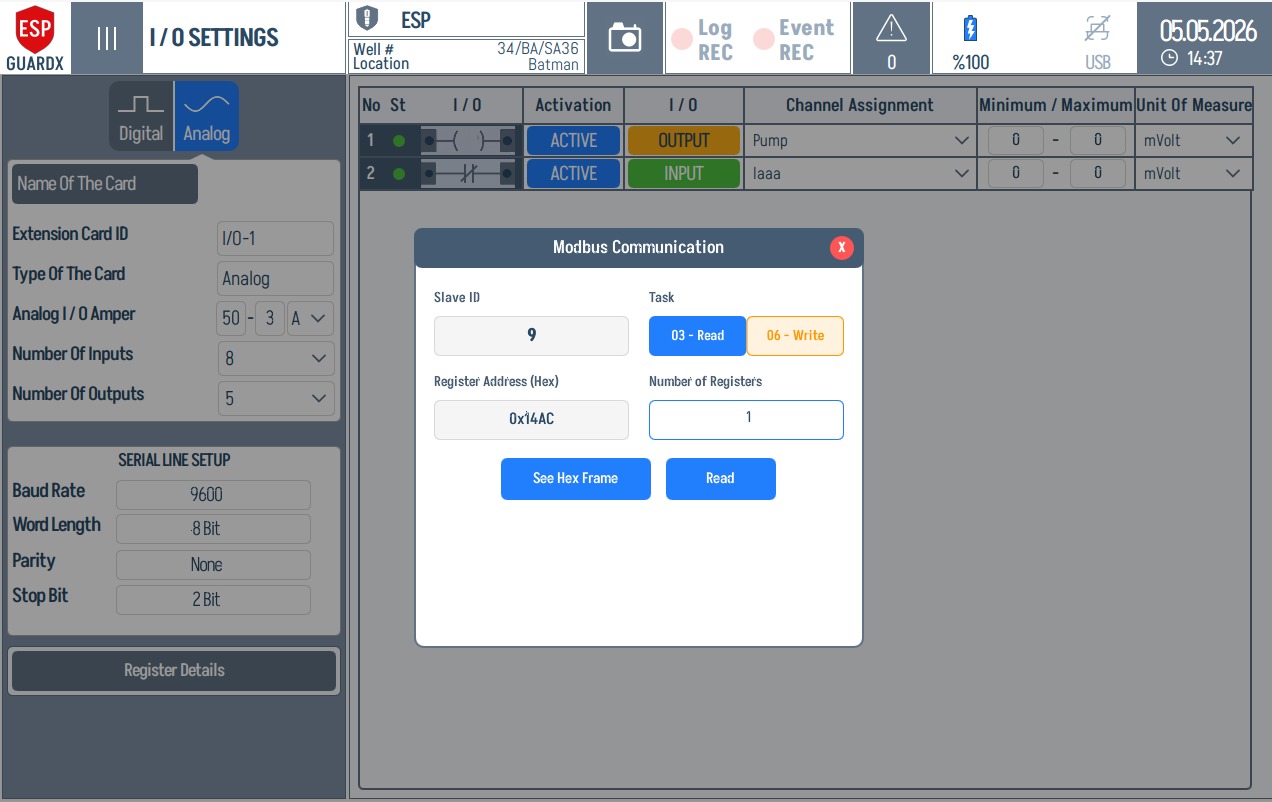
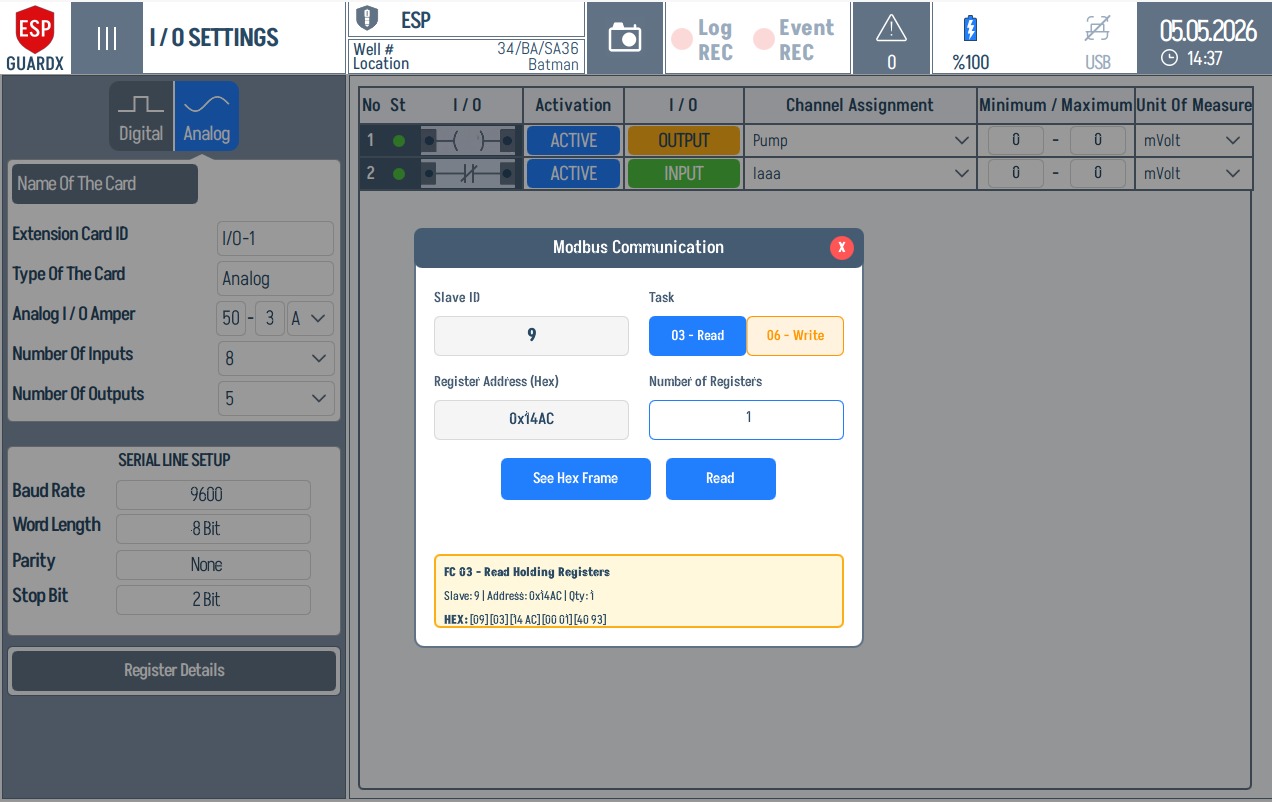
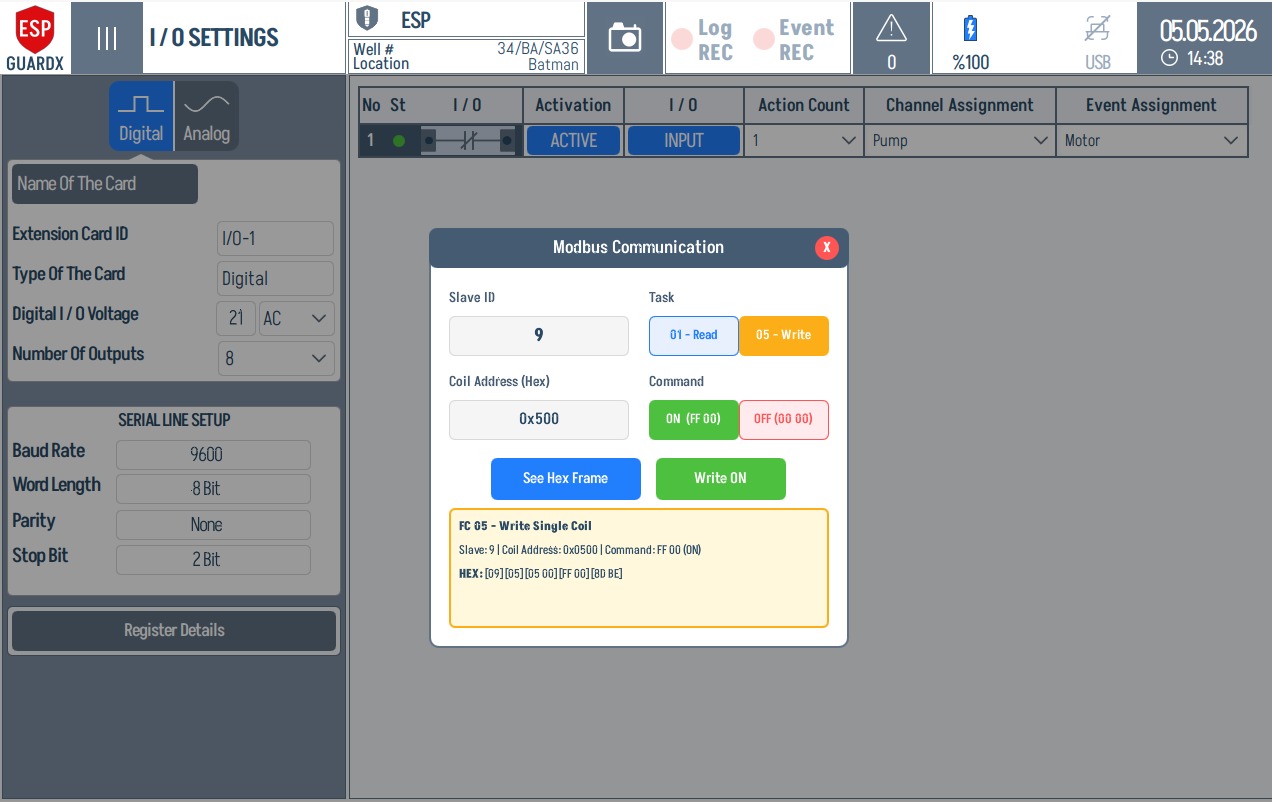
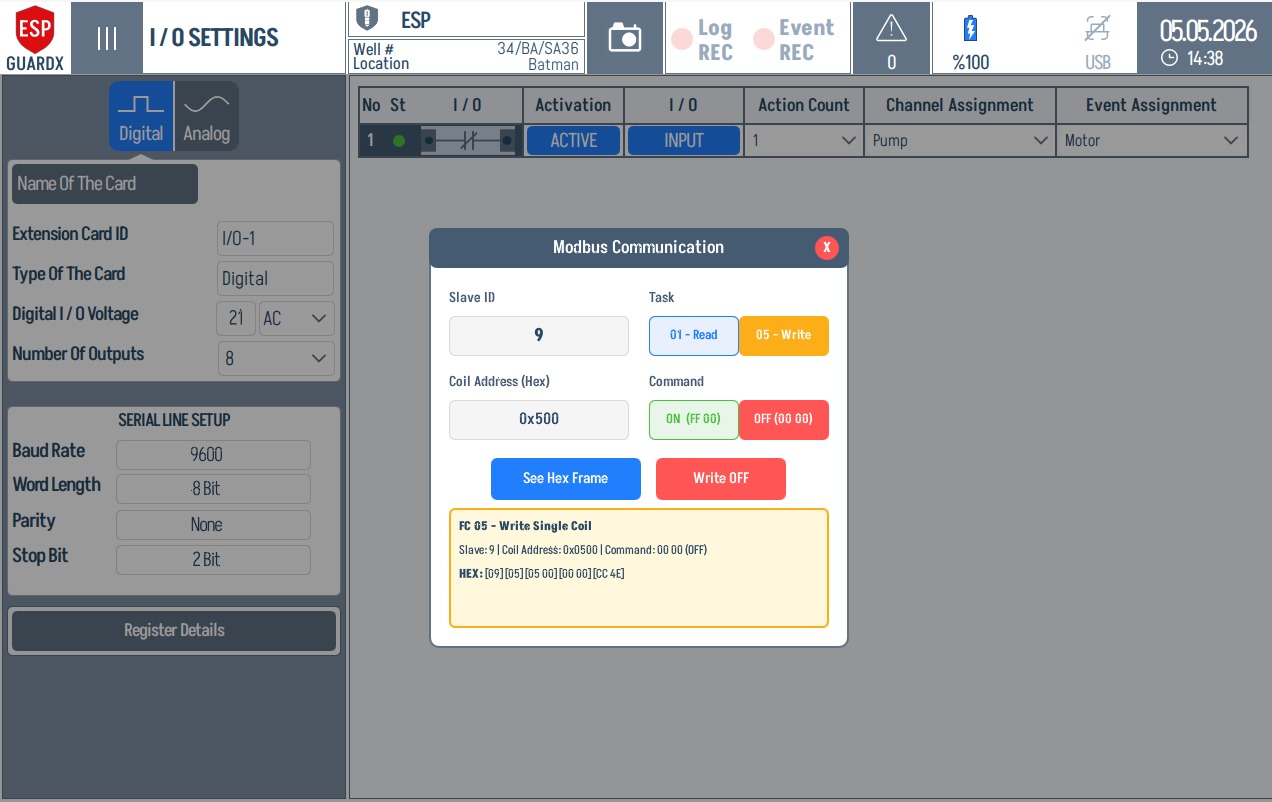
When See Hex Frame is selected, the dialog shows the function code, slave ID, register address, quantity or value, and the generated HEX request.
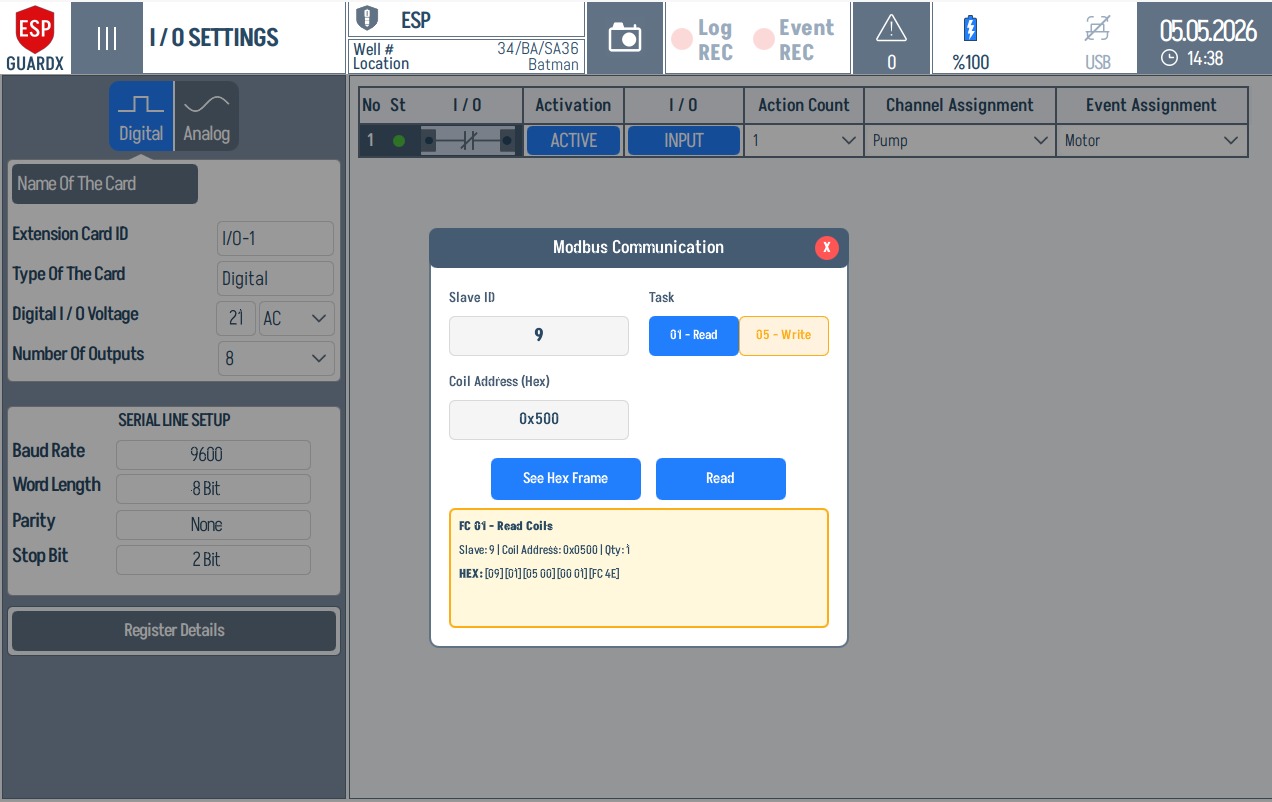
Digital channels use coil-oriented commands such as 01 - Read Coils and 05 - Write Single Coil. The ON / OFF buttons generate the coil command before it is sent.
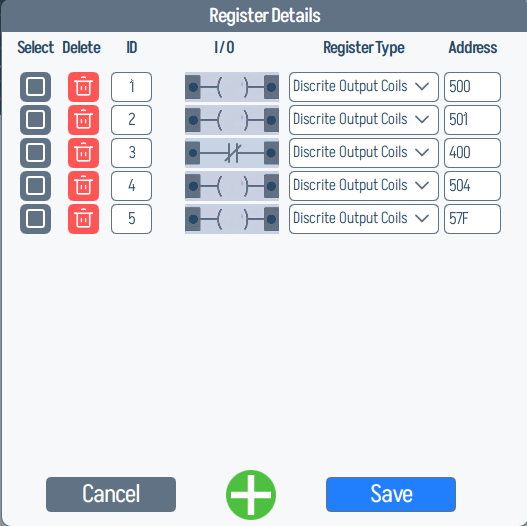
Register Details (I/O Modbus)
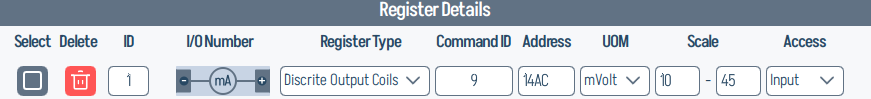
Both tabs offer a Register Details dialog for mapping each channel to a Modbus register (ID, register type, command ID, address, UOM, scale, access).
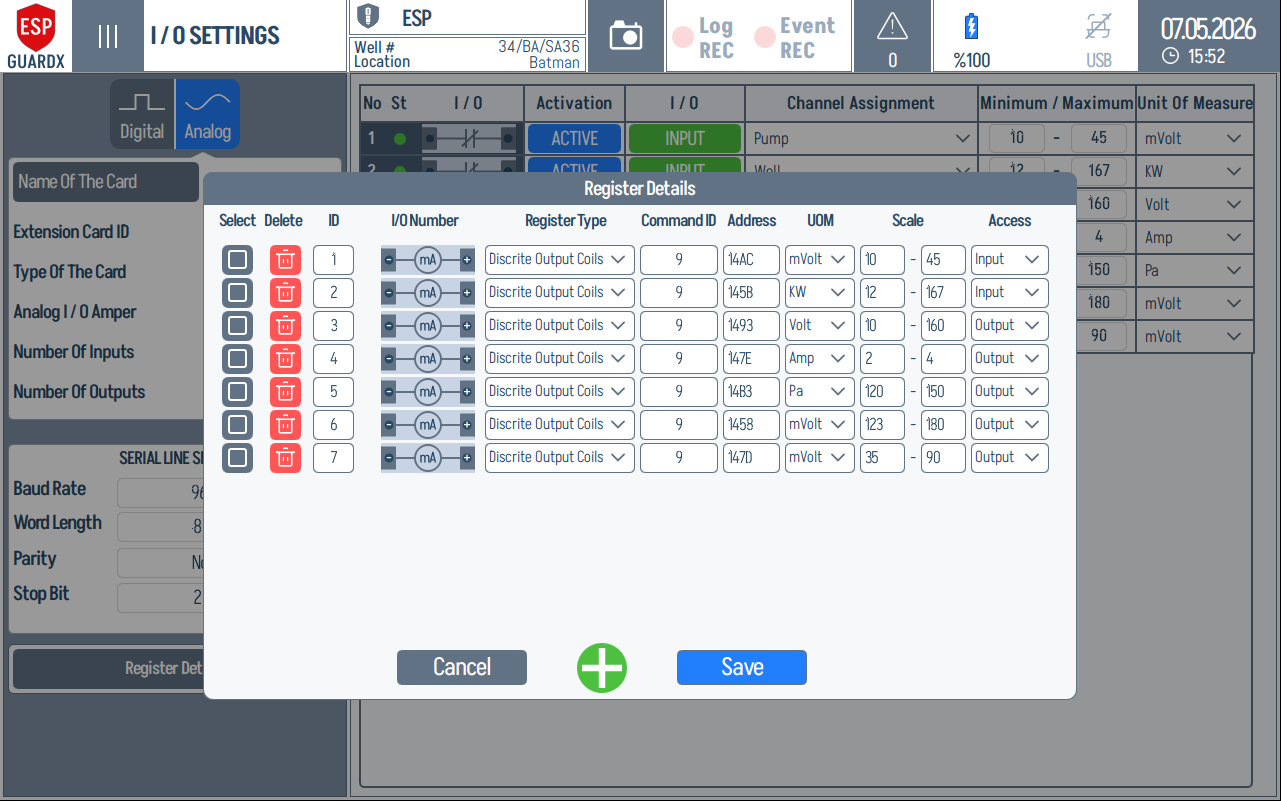
A zoomed view of one register row, showing Select / Delete / ID / I/O Number / Register Type / Command ID / Address / UOM / Scale / Access fields:
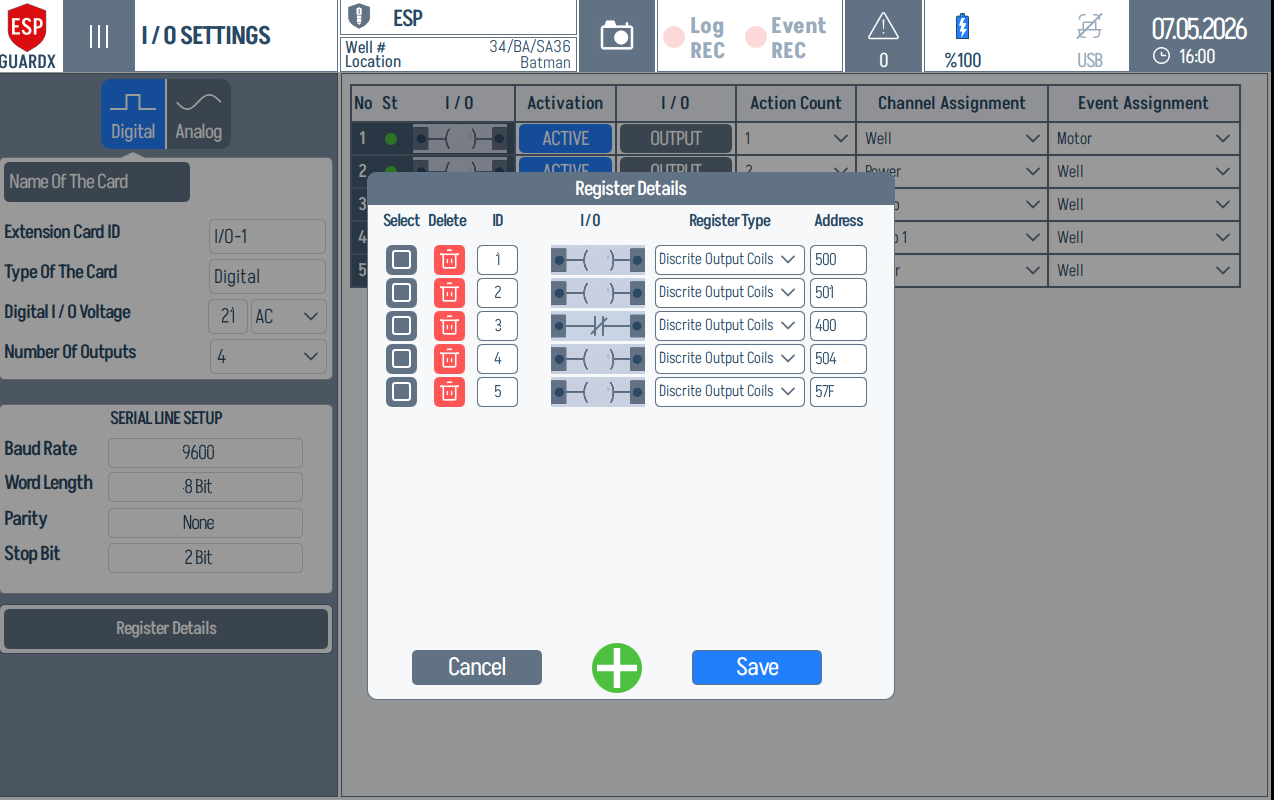
The digital-side dialog is the same layout but constrained to discrete-input / discrete-output register types: