AI Optimization Logic
This section describes the optimization logic used to compare the current well operating point against the reservoir inflow, tubing outflow, and pump performance curves. The goal is to identify a practical operating point that keeps production close to the required rate while improving pump efficiency and reducing power consumption.
The workflow below covers the simple case where the produced fluid is treated as oil or water only, without mixed-flow modeling.
Workflow Summary
- Build the reservoir inflow curve from
PI,SBHP, and a sweptFBHP. - Build the tubing outflow curve from wellhead pressure, gravity head, and friction loss.
- Subtract inflow pressure from outflow pressure to get the system curve.
- Overlay the system curve on the pump curve.
- Compare the current operating point against BEP and the safe operating window.
- Select the frequency and head requirement that preserve the accepted production target with better efficiency and lower power.
Required Data
The optimizer needs three groups of inputs:
| Input group | Examples |
|---|---|
| Sensor data | Pump intake pressure, pump discharge pressure, and related downhole readings |
| Surface data | Wellhead pressure, operating frequency, and flow rate |
| Well constants | SBHP, FBHP, and PI |
Variable Reference
| Term | Meaning |
|---|---|
PI |
Productivity index |
SBHP |
Static bottomhole pressure |
FBHP |
Flowing bottomhole pressure |
WHP / PTHP |
Wellhead pressure / tubing head pressure |
SG |
Specific gravity of the produced fluid used for the initial fluid-gradient calculation |
GAVG |
Average fluid gradient used in the friction-loss estimate |
HFriction |
Tubing friction-loss factor from API tubing tables or equivalent calculation |
Pi |
Pump intake pressure |
Pd |
Pump discharge pressure |
BEP |
Best efficiency point |
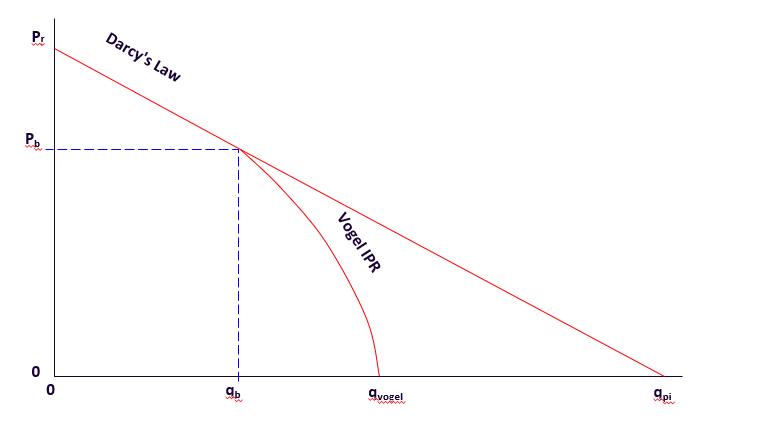
Inflow Curve
The inflow curve estimates the flow rate available from the reservoir.
Use:
Q = PI * (SBHP - FBHP)
Where:
| Term | Meaning |
|---|---|
Q |
Flow rate |
PI |
Productivity index, provided by the end user |
SBHP |
Static bottomhole pressure, provided by the end user |
FBHP |
Flowing bottomhole pressure, swept from 0 to SBHP to plot the curve |
Outflow Curve
The outflow curve estimates the pressure required to lift the fluid to surface.
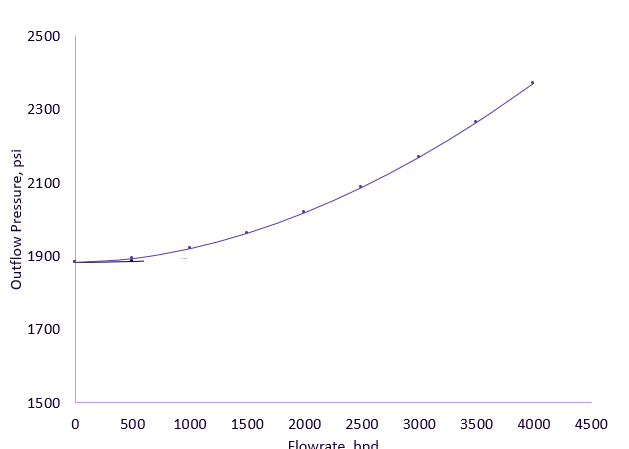
Use:
Po = PTHP + PGravity + PFriction
Where:
| Term | Meaning |
|---|---|
PTHP |
Tubing head pressure or wellhead pressure. For an initial plot, use a constant average measured value. |
PGravity |
Vertical depth multiplied by fluid gradient. PGravity = vertical depth * (SG * 0.433). |
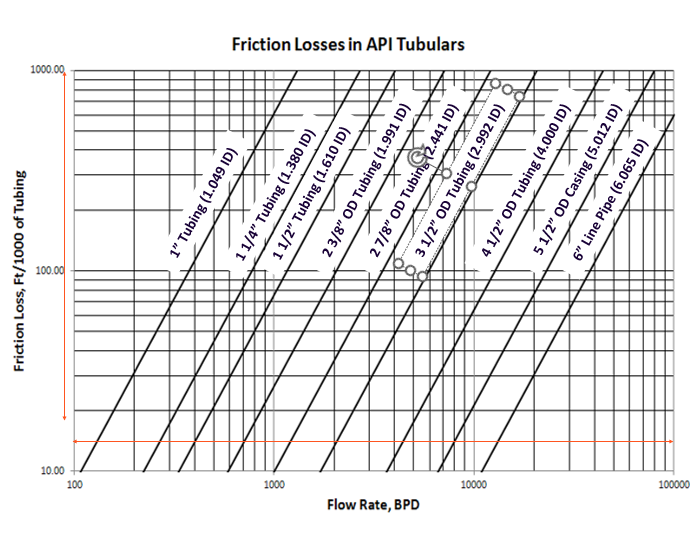
PFriction |
Friction pressure loss. PFriction = GAVG * HFriction. |
HFriction |
Friction loss from API tubing tables or an equivalent tubing friction calculation. |
Plot the inflow and outflow curves in the same chart. Their intersection is the natural operating point for the well when the ESP contribution is not included.
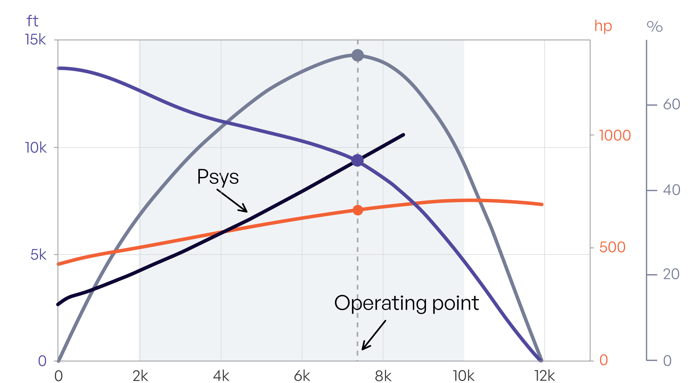
System Curve
After the inflow and outflow curves are calculated, plot the system curve.
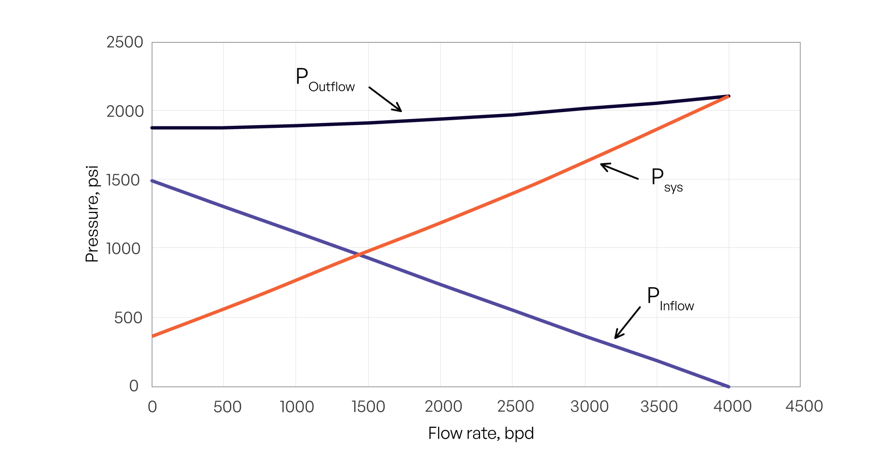
Use:
Psys = Poutflow - Pinflow
The system curve represents the head that the pump must add at each flow rate.
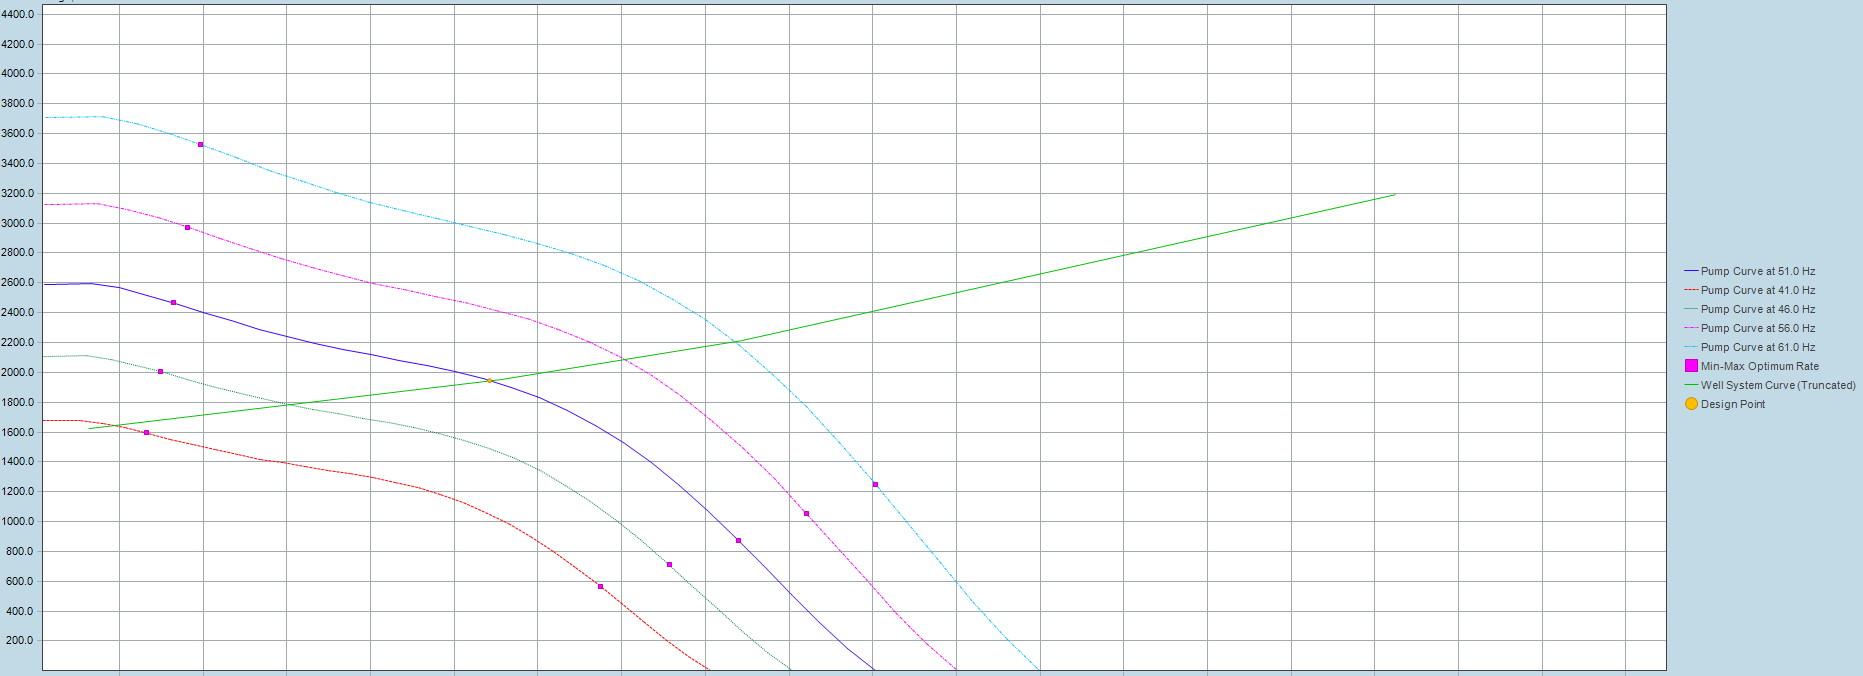
Pump Curve Comparison
Plot the system curve against the pump performance curve to compare the current production point with the pump's best efficiency point.
The comparison should answer two questions:
| Check | Meaning |
|---|---|
| Is the intersection at BEP? | If yes, no optimization action is required. |
| Is the point away from BEP? | Review alternate frequencies and the allowed operating window. |
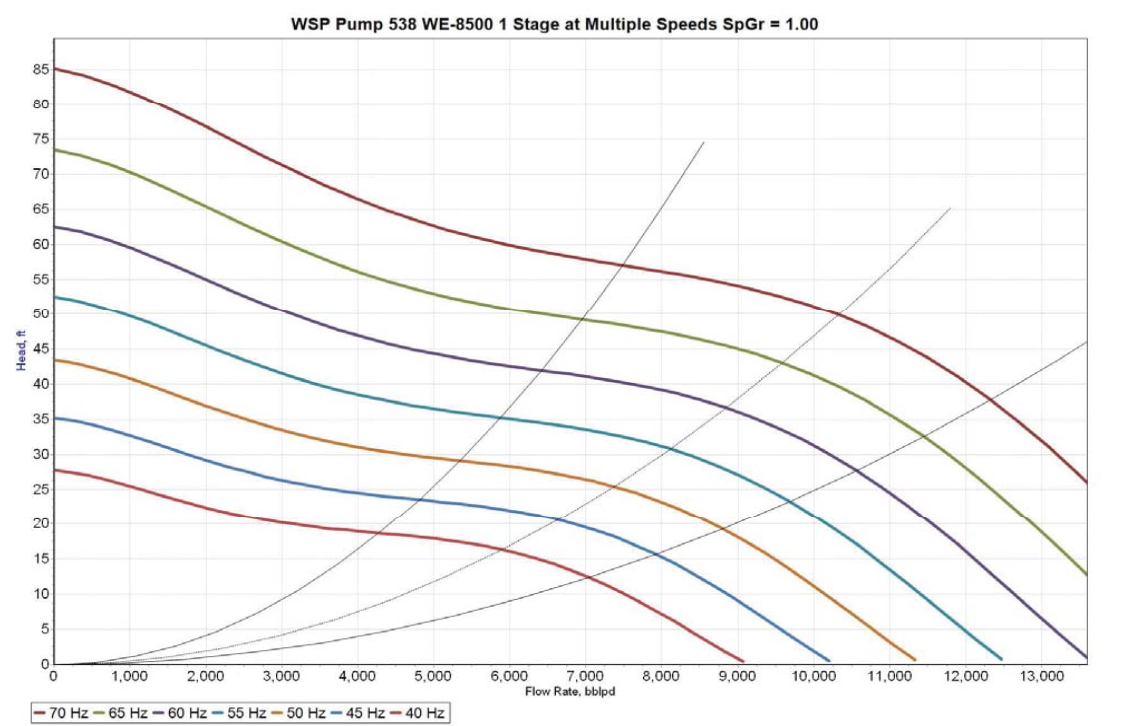
When the current point is not at BEP, the optimizer should check other pump curves at different frequencies and keep the operating point inside the safe operating window.
Selecting the Optimized Point
Select the point that gives the maximum practical efficiency, consumes less power, and stays closest to the accepted production rate.
That selected point gives the new required pump head. In this context, required head is the pressure rise across the pump:
Required Head = Pd - Pi
Where Pd is pump discharge pressure and Pi is pump intake pressure.
Flow-Rate Constraint Example
If the well has a required production rate constraint, optimize around that target.
Example:
| Condition | Value |
|---|---|
| Required flow | 8000 BPD |
| Current operating frequency | 60 Hz |
| Current production | 8000 BPD |
| Candidate optimized frequency | 54 Hz |
In this case, reducing frequency to 54 Hz can still deliver the required 8000 BPD while moving the pump closer to a better efficiency region and reducing power consumption.
Operator Guidance
Use AI optimization as a decision-support tool. Before applying a recommendation, confirm:
| Check | Why it matters |
|---|---|
| The live sensor values are current | Stale intake, discharge, wellhead, or flow values move the calculated point. |
| The production constraint is correct | The optimizer should not reduce flow below the accepted operating target. |
| The point remains inside the operating window | Efficiency gains should not push the pump into downthrust, upthrust, or unstable operation. |
| The recommended head is physically achievable | The selected Pd - Pi must match what the pump can produce at the chosen frequency. |